Do you want BuboFlash to help you learning these things? Or do you want to add or correct something? Click here to log in or create user.
#has-images #quantitative-methods-basic-concepts #statistics
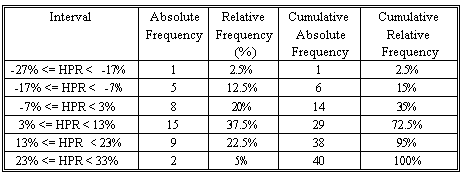
The relative frequency for a class is calculated by dividing the number of observations in a class by the total number of observations and converting this figure to a percentage (multiplying the fraction by 100). Simply, relative frequency is the percentage of total observations falling within each interval. It is another way of analyzing data; it tells us, for each class, what proportion (or percentage) of data falls in that class.


Let's look at an example.
The following table shows the holding period returns of a portfolio of 40 stocks.

The highest HPR is 32% and the lowest one is -27%. Let's use 6 non-overlapping intervals, each with a width of 10%. The first interval starts at -27% and the last one ends at 33%. Therefore, the entire range of the HPRs is covered.

Hint: If, in an examination, your relative frequency column does not sum to 1 (or 100%), you know that you have made a mistake.
If you want to change selection, open document below and click on "Move attachment"
Subject 3. Frequency Distribution
to draw a histogram in pencil, then to plot the points and join the lines, and finally to rub out the histogram. In this way, the histogram can be used as an initial guide to drawing the polygon. <span>The relative frequency for a class is calculated by dividing the number of observations in a class by the total number of observations and converting this figure to a percentage (multiplying the fraction by 100). Simply, relative frequency is the percentage of total observations falling within each interval. It is another way of analyzing data; it tells us, for each class, what proportion (or percentage) of data falls in that class. Let's look at an example. The following table shows the holding period returns of a portfolio of 40 stocks. The highest HPR is 32% and the lowest one is -27%. Let's use 6 non-overlapping intervals, each with a width of 10%. The first interval starts at -27% and the last one ends at 33%. Therefore, the entire range of the HPRs is covered. Hint: If, in an examination, your relative frequency column does not sum to 1 (or 100%), you know that you have made a mistake.<span><body><html>
Summary
| status | not read | reprioritisations | ||
|---|---|---|---|---|
| last reprioritisation on | suggested re-reading day | |||
| started reading on | finished reading on |
Details
Discussion
Do you want to join discussion? Click here to log in or create user.