Do you want BuboFlash to help you learning these things? Or do you want to add or correct something? Click here to log in or create user.
Subject 3. Market Equilibrium
#cfa #cfa-level-1 #economics #has-images #microeconomics #reading-13-demand-and-supply-analysis-introduction #subject-3-market-equilibrium
Aggregate Demand and Aggregate Supply


An aggregate demand curve is simply a schedule that shows amounts of a product that buyers collectively desire to purchase at each possible price level.
An aggregate supply curve is simply a curve showing the amounts of a product that all firms will produce at each price level.
Example 1
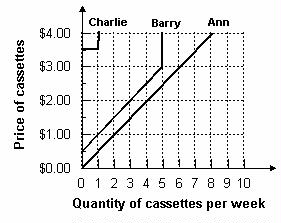
Refer to the graph below. What is the market quantity that would be supplied at a price of $2.00?

Market quantity is the sum of individual quantities supplied at each price. At a price of $2.00, Ann supplies 4, Barry supplies 3, and Charlie supplies 0. The market supply is 7.
Market Equilibrium
Equilibrium is a state in which conflicting forces are in balance. In equilibrium, it will be possible for both buyers and sellers to realize their goals simultaneously.
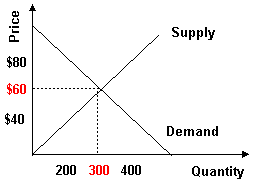
The following graph depicts the market supply and demand for concert tickets at Madison Square Garden in New York City.

Equilibrium price and quantity are where the supply and demand curves intersect. Draw a horizontal line from the intersection to the price axis. This is equilibrium price: $60. Draw a vertical line from the intersection to the quantity axis. This is equilibrium quantity: 300. It is equilibrium because quantity demanded equals quantity supplied at $60 per ticket. At this price, there is neither surplus (excess supply) nor shortage (excess demand), so there is no downward or upward pressure for the price to change.
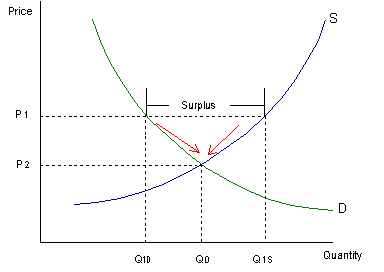
Surplus will push prices downward towards equilibrium.

- Suppose the price is initially above the equilibrium price (P2) and sits at P1.
- Quantity supplied (Q1s) will exceed quantity demanded (Q1D), creating a surplus.
- The surplus will put downward pressure on prices since producers will begin to lower their prices to sell the surplus.
- As a result, the price will fall, the quantity supplied will decrease, and the quantity demanded will increase until the equilibrium price (P2) is restored.
- This process involves movements along supply-and-demand curves since the changes are caused by price fluctuations.
Similarly, shortages push prices upward towards equilibrium.
Because the price rises if it is below equilibrium, falls if it is above equilibrium, and remains constant if it is at equilibrium, the price is pulled toward equilibrium and remains there until some event changes the equilibrium. We refer to such an equilibrium as being stable because whenever price is disturbed away from the equilibrium, it tends to converge back to that equilibrium.
An unstable equilibrium is an equilibrium that is not restored if disrupted by an external force. While most equilibria studied in economics are of the stable variety, a few cases of unstable equilibria do emerge from time to time, in limited circumstances.
If you want to change selection, open original toplevel document below and click on "Move attachment"
Summary
| status | not read | reprioritisations | ||
|---|---|---|---|---|
| last reprioritisation on | suggested re-reading day | |||
| started reading on | finished reading on |
Details
Discussion
Do you want to join discussion? Click here to log in or create user.