Do you want BuboFlash to help you learning these things? Or do you want to add or correct something? Click here to log in or create user.
Subject 6. Market Interference: The Negative Impact on Total Surplus
#cfa #cfa-level-1 #economics #has-images #microeconomics #reading-13-demand-and-supply-analysis-introduction
The equilibrium price set by the market mechanism is often deemed to be unfair: buyers complain that the price is too high, while sellers believe that it is too low. In such cases, the government may regulate the price of the good or service. This is known as price control. A price control is a government-mandated price that may either be greater or less than the market equilibrium price. Price ceilings and floors are two types of price controls.
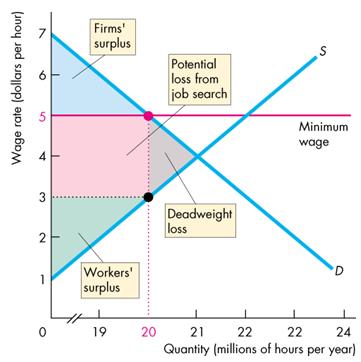
A Price Ceiling
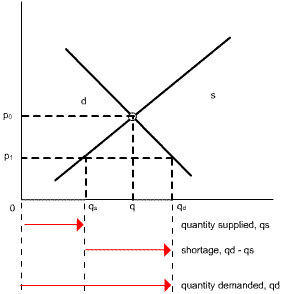
A price ceiling is a legal restriction that prohibits exchanges at prices greater than a designated price: the ceiling price. Price ceilings are usually imposed when the equilibrium price is considered too high to be fair. A typical price ceiling results in a lower price than market forces would produce. A shortage will result in a situation in which the quantity demanded by consumers exceeds the quantity supplied by producers at the existing price.
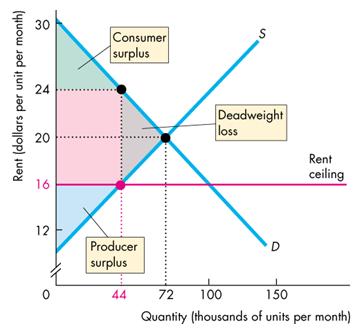
A typical example of a price ceiling is a "rent ceiling," implemented by over 200 U.S. cities. If the rent ceiling is set above the equilibrium rent, it has no effect. The market works as if there were no ceiling. But if the rent ceiling is set below the equilibrium rent, it has powerful effects.

If a rent ceiling is set below the equilibrium price P0, for example, at P1, there is a reduction in the quantity that producers are willing to supply qs and an increase in the quantity that consumers demand qd relative to the original equilibrium quantity q.
Because the legal price cannot eliminate the shortage, other mechanisms operate. For example, a black market is an illegal market that operates alongside a legal market in which a price ceiling or other restriction has been imposed. A shortage of housing creates a black market in housing. Illegal arrangements are made between renters and landlords at rents above the rent ceiling - and generally above what the rent would have been in an unregulated market.
A rent ceiling leads to an inefficient use of resources. The quantity of rental housing is less than the efficient quantity and there is a deadweight loss.

A rent ceiling decreases the quantity of rental housing, shrinks the total producer and consumer surplus by using resources such as search activity, and creates a deadweight loss. It also transfers part of the producer surplus from producers to consumers. The consumer surplus becomes the green area + the pink area.
A Price Floor
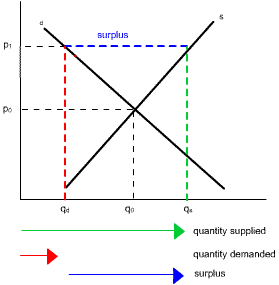
A price floor is a minimum price that can be legally charged. It usually fixes the price of a good or resource above the market equilibrium level. Price floors are usually imposed when the equilibrium price is considered too low to be fair. Agricultural price supports and minimum wage legislation are examples of price floors.

If a price floor is set above the equilibrium price, p0, for example, at p1, there is a reduction in quantity demanded from q0 to qd, whilst the quantity supplied increases from q0 to qs. The result is a surplus of qs-qd.
Example 1
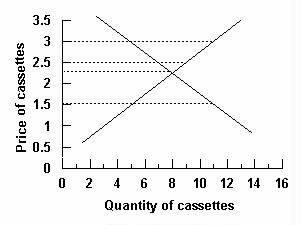
Refer to the graph below. A price floor set by the government would be binding and cause the greatest distortion in the market if it were established at what price?

Answer: $3.00.
Given the supply and demand curves in the graph, the equilibrium price is $2.25. A price floor will be binding only if it is above the equilibrium price. So a price floor of $1.50 would not distort the market. The higher the floor above equilibrium price, the greater the market distortion (surplus). A price floor at $3.00 would create a larger surplus than a price floor at $2.50.
It creates a deadweight loss.

Note that a surplus does not mean the good is no longer scarce: people just desire less of the good at the current price than sellers desire to bring to the market. A decline in price would eliminate the surplus but not the scarcity of the item.
Taxes
When a tax is imposed, the government can make either the buyer or the seller legally responsible for payment of the tax. However, the person who writes the check to the government is not necessarily the one who bears the tax burden.
Example 2
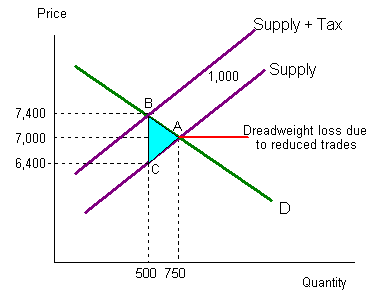
The following graph illustrates how a $1,000 tax placed on the sale of used cars would affect the market. Assumption: all used cars are identical.

- Before the imposition of the tax, used cars sold for a price of $7,000 (point A).
- The tax has statutorily been placed on the seller, shifting the supply curve upward by exactly the amount of tax ($1,000).
- Now the price will rise to $7,400 (point B). Therefore, despite the tax being statutorily imposed on sellers, the higher price shifts some of the tax burden to buyers.
- A buyer will now pay $400 more for a used car.
- A seller now receives $7,400 from the sale of a used car, but after sending the tax of $1,000 to the government, the seller retains only $6,400. This is exactly $600 less than the seller would have received had the tax not been imposed.
- In this case, each $1,000 of tax revenue transferred to the government imposes a burden of $400 on the buyer and a $600 burden on the seller.
- As the example shows, the imposition of the $1,000 tax on used cars causes the number of units exchanged to fall from 750 to 500. As trade results in mutual gains for both buyers and sellers, the loss of mutual benefits that would have been derived had the tax not eliminated 250 units of exchange also imposes a cost on buyers and sellers. The loss is referred to as the deadweight loss of taxation. In the graph, the triangle ABC measures the size of the deadweight loss. It generates neither revenue for the government nor gains for any other party.
The effects of a tax depend on the responsiveness of buyers and of sellers to a change in price. It tends to fall more heavily on whichever side of the market has the least attractive options elsewhere and thus is less sensitive to price changes. This is because an inelastic curve indicates there are few substitutes available.
- When demand is relatively inelastic and supply elastic, the primary burden of a tax will fall on buyers.
Initially, gas costs 50 cents per liter and 1,000 liters are sold per day. The demand curve is relatively inelastic, indicating there are few alternatives to gas.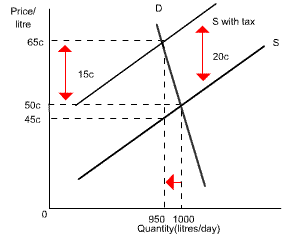
A 20c tax per liter on suppliers shifts the supply curve up by 20c, establishing a new equilibrium price (65c) and quantity (950 liters). Consumers pay 15c more - meaning they have paid 15c of the 20c tax. Suppliers receive 65c from consumers, pay 20c to the government and are left with 45c - 5c less than before. Suppliers have thus paid 5c towards the tax.
The tax burden is thus:- Consumers: 15c
- Suppliers: 5c
Consumers pay more because their demand curve was relatively more inelastic than the supply curve. - When demand is relatively elastic compared to supply, sellers will bear the larger share of the tax burden.
Consider the diagram below. Here demand is relatively elastic and supply relatively inelastic.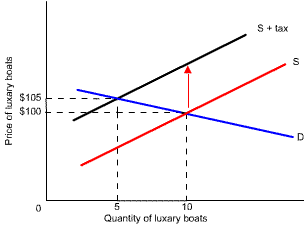
The demand for luxury boats is relatively elastic as rich people have many alternatives as to how to spend their money. A $25,000 tax on the sale of these boats thus causes a large reduction in the quantity demanded (10 thousand to 5 thousand).
As the selling price only rises from $100,000 to $105,000, buyers have only paid only $5,000 of the tax. Sellers have thus paid $20,000 and received only $80,000 per yacht sold. - The deadweight loss is reduced if the elasticity of either demand or supply is reduced (i.e., its curve becomes steeper). Except in the extreme cases of perfectly inelastic demand or supply when the quantity remains the same, imposing a tax creates inefficiency.
In practice, taxes usually are levied on goods and services with an inelastic demand or an inelastic supply. Alcohol, tobacco, and gasoline have inelastic demand, so the buyers of these items pay most of the tax on them. Labor has a low elasticity of supply, so the seller - the worker - pays most of the income tax and most of the Social Security tax.
If you want to change selection, open original toplevel document below and click on "Move attachment"
Summary
| status | not read | reprioritisations | ||
|---|---|---|---|---|
| last reprioritisation on | suggested re-reading day | |||
| started reading on | finished reading on |
Details
Discussion
Do you want to join discussion? Click here to log in or create user.