Do you want BuboFlash to help you learning these things? Or do you want to add or correct something? Click here to log in or create user.
Subject 5. Revisiting the Consumer's Demand Function
#cfa #cfa-level-1 #economics #has-images #microeconomics #reading-14-demand-and-supply-analysis-consumer-demand #subject-5-revisiting-the-consumers-demand-function
Indifference curve analysis lies behind a demand curve. It can be used to examine the effect of price changes and income changes.
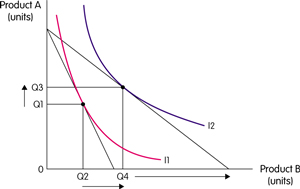
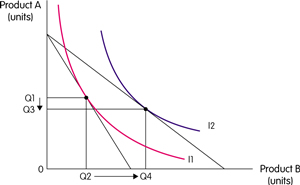
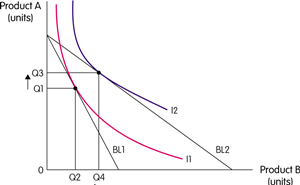
If the price of B now falls, the budget line will pivot. The consumer now maximises utility consuming Q3 of product A and Q4 of product B. The fall in the price of product B has led to an increase in the quantity demanded of Q2Q4. This can be shown on a demand curve.

There are two different phenomena underlying a consumer's response to a price drop:
- As the price of a product declines, the lower opportunity cost will induce consumers to buy more of it since it becomes less expensive - even if they have to give up other products. This is called the substitution effect.
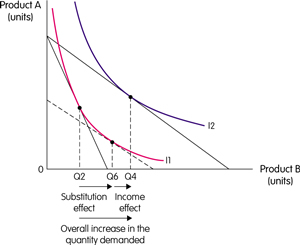
To isolate this effect diagrammatically, we move the new budget line inwards and parallel until it is tangent to the old indifference curve. The new slope reflects the new relative prices but the utility is the same as it was originally. The substitution effect is Q2Q6. The substitution effect will always lead to more of the relatively cheaper product being demanded. - With a fixed amount of money income, a reduction in the price of a product will increase a consumer's real income - the amount of goods and services consumers are able to purchase. Typically, consumers will respond by purchasing more of the cheaper products (as well as other products). This is called the income effect. The income effect is identified by shifting the budget line back outwards again. In this case, this leads to an increase in the quantity demanded of Q6 Q4.
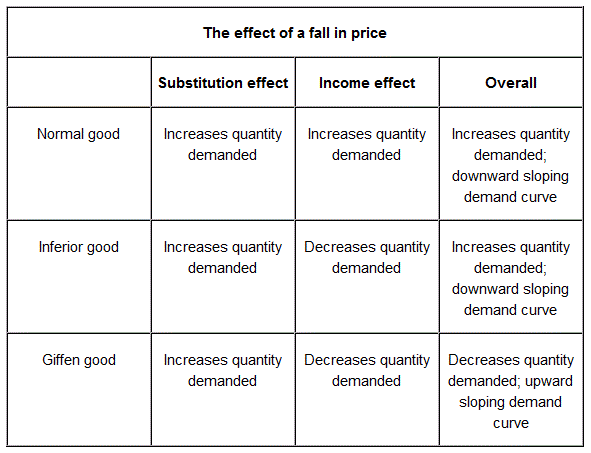
The substitution and income effects will generally work in the same direction, causing consumers to purchase more as the price falls and less as the price rises. The indifference curve can be used to separate these two effects.
In the case of a normal good, higher real income leads to an increase in quantity demanded; this complements the increase due to the substitution effect. This change is shown in the diagram below.

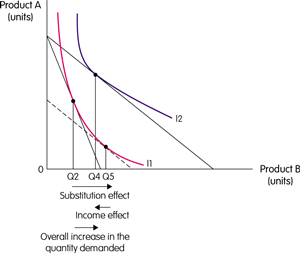
In the case of an inferior product, the income effect leads to a fall in the quantity demanded, which will work against the substitution effect. In the following diagram the substitution effect is Q2 Q5; the income effect is Q5 Q4. However, the substitution effect outweighs the income effect and overall the quantity demanded rises. The overall change in quantity demanded results in an increase of Q2 Q4. This means the demand curve is downward-sloping, because a price fall increases the quantity demanded.

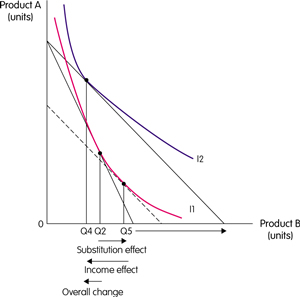
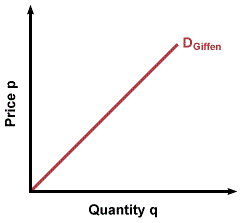
When a good is inferior and the income effect outweighs the substitution effect, it is called a Giffen good. This is, however, unlikely, because the substitution effect is almost always stronger than the income effect.


Another exception is the case where an increase in price causes an increase in demand. This results in an upward-sloping demand curve, and the good is called a Veblen good.
One possible justification for a Veblen good is that people associate higher prices with status, luxury, and quality, so that a higher price might increase the perceived value of a good.
Substitutes and Complements
Indifference curve analysis will also allow us to see whether two products are substitutes or complements.

In the diagram above, a fall in the price of product B has led to a change in the budget line. As a result, more of product B and less of product A are bought. The products are substitutes. The consumer has switched from product A to product B.

In the diagram above the price of product B has fallen. This has led to an increase in the quantity demanded of A and B; the two products are complements. A lower price leads to more of both goods being bought.
If you want to change selection, open original toplevel document below and click on "Move attachment"
Summary
| status | not read | reprioritisations | ||
|---|---|---|---|---|
| last reprioritisation on | suggested re-reading day | |||
| started reading on | finished reading on |
Details
Discussion
Do you want to join discussion? Click here to log in or create user.