Do you want BuboFlash to help you learning these things? Or do you want to add or correct something? Click here to log in or create user.
Subject 7. Productivity
#cfa #cfa-level #economics #has-images #microeconomics #reading-15-demand-and-supply-analysis-the-firm
Average product and marginal product, which are derived from total product, are key measures of a firm's productivity.


- Total Product. The total output of a good associated with alternative utilization rates of a variable input. It increases as more and more units of the variable input are used.
- Marginal Product. The increase in the total product as a variable input increases by one extra unit.
- Average Product. The total product divided by the number of units of the variable input used in production.
Law of Diminishing Returns
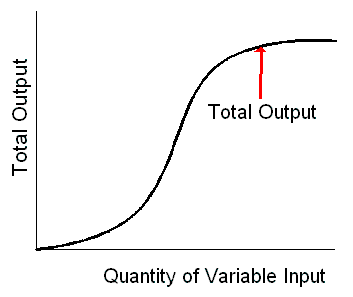
The total product curve shows how total product changes with the quantity of variable input employed.

As more and more units of a variable resource are combined with a fixed amount of other resources, employment of additional units of the variable resource will eventually increase output only at a decreasing rate. Once diminishing returns are reached, it will take successively larger amounts of the variable factor to expand output by one unit.
The law basically explains the old adage: "too many cooks spoil the broth," or too much of a good thing is bad. As a single resource is applied more intensively, the resource eventually tends to accomplish less and less. Essentially, this is a constraint imposed by nature.
Let's use labor as the input. Initially, hiring more laborers may mean more productive use of machines, which were underutilized. Output may thus initially increase. After a while, the firm may have hired too many laborers, given the number of machines. There may be overcrowding on the work floor and mistakes may result, causing productivity to fall whilst costs will increase.

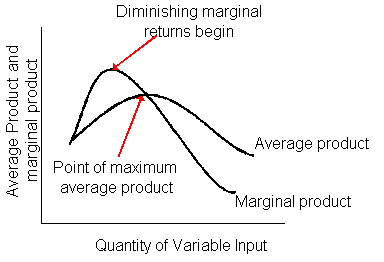
As units of variable input are added to a fixed input, total product will increase, first at an increasing rate and then at a declining rate. This will cause both marginal and average product curves to rise at first and then decline. Note that the marginal product curve intersects the average product curve at its maximum. The smooth curves indicate that the input can be increased by amounts of less than a single unit.
Profit Maximization
Firms demand labor, amongst other factors, to produce goods and services. The Marginal Revenue Product (MRP) of labor is the change in the total revenue of a firm that results from the employment of one additional unit of labor. The marginal revenue product of an input is equal to its marginal product multiplied by the marginal revenue of the good or service produced: MRP = MP x MR, where
- Marginal Product (MP) is the change in total output that results from the employment of one additional unit of labor.
- Marginal Revenue (MR) is the change in a firm's total revenue that results from the production and sale of one additional unit of output.
Because of the law of diminishing returns, the marginal product of labor will fall as employment of the labor expands, and thus the marginal revenue product of labor will also fall as employment expands.
The firm has two equivalent conditions for maximizing profit. They are:
- Hire the quantity of labor at which the marginal revenue product of labor (MRP) equals the wage rate (W).
- Produce the quantity of output at which marginal revenue (MR) equals marginal cost (MC).
Why?
MRP = W => MP x MR = W => MR = W/MP, since W/MP = MC => MR = MC.
This relationship indicates why wage differences across skill categories will tend to reflect productivity differences. If skilled workers are twice as productive as unskilled workers, their wage rates will tend toward twice the wage rates of unskilled workers. Low wages do not necessarily mean low cost; it is not always cheaper to hire the lowest wage workers.
Example
A mutual fund hiring research analysts is choosing among CFA charterholders and non-CFA charterholders. A CFA charterholder makes $200,000 per year and analyzes 400 stocks per year. A non-CFA charterholder makes $100,000 per year and can cover 100 stocks per year. Therefore, MCCFA = 200,000/400 = 500 and MCNON-CFA = 100,000/100 = 1,000.
As a result, the mutual fund will choose to hire CFA charterholders because they are twice as productive as non-CFA charterholders. This will cause the wages (price) of CFA charterholders to rise and the wages of non-CFA charterholders to fall until the ratios of the marginal product of each resource to its price (MP/P) are equal.
If you want to change selection, open original toplevel document below and click on "Move attachment"
Summary
| status | not read | reprioritisations | ||
|---|---|---|---|---|
| last reprioritisation on | suggested re-reading day | |||
| started reading on | finished reading on |
Details
Discussion
Do you want to join discussion? Click here to log in or create user.