Do you want BuboFlash to help you learning these things? Or do you want to add or correct something? Click here to log in or create user.
Subject 3. Aggregate Demand
#cfa #cfa-level-1 #economics #has-images #macroeconomics #reading-17-aggregate-output-and-economic-growth
Aggregate demand (AD) is the quantity of goods and services that households, businesses, and foreign customers want to buy at any given level of prices.


The IS Curve
GDP = C + I + G + (X - M)
- Consumption (C) is a function of disposable income. Consumption increases when income(Y) increases and/or taxes decrease.
The marginal propensity to consume (MPC) is defined as additional current consumption divided by additional current disposable income. The marginal propensity to save (MPS) = 1 - MPC. - Investment spending depends on the interest rate (i) and output/income level.
- Government purchases are assumed to be unrelated to both interest rates (i) and income (Y). Although tax policy is also considered an exogeneous variable, the actual taxes collected depend on income (Y) and are therefore endogenous. The government's deficit (G - T) increases as income decreases and vice versa.
- Net exports (X - M) depends on relative income and prices between the domestic country and the rest of the world.
We can also derive the following equation, which shows that domestic saving has three uses: investment, government deficits, and trade surplus:
S = I + (G - T) + (X - M), where S is domestic saving.
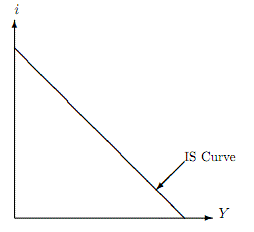
If we combine these relationships together we can derive the IS curve: the combination of GDP (Y) and the real interest rate (i) such that aggregate income/output equals planned expenditures.

Note that there is an inverse relationship between income and the real interest rate. For example, when interest rates are high, investment falls and therefore Y must fall as well.
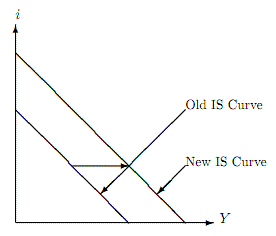
Note that changes in Y caused by changes in i are reflected as movements along the IS curve. On the other hand, changes in Y that are brought about by factors other than interest rates will cause Y to change, regardless of the level of interest rates in the economy. For example, changes in government purchases will not change the slope but will change the intercepts; in other words, they will cause the IS curve to shift.

The LM Curve
The IS curve depicts combinations of interest rates and output that clears markets for goods and services. The IS curve by itself does not pin down the interest rate that prevails in the economy. In order to do so, we look at the money market. The LM curve summarizes all the combinations of income and interest rates that equate money demand and money supply.
The quantity theory of money: MV = PY, where V is the velocity of money.
- When interest rates (i) are high, the demand for money is low because money pays no interest; the opportunity cost of holding money rises.
- When Y is high, the demand for money is high; richer people buy more goods and are likely to hold more money.
- When P is hig,h the demand for money is high because we need more money to buy goods.
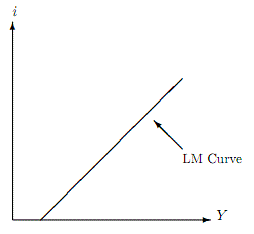
When the money market is in equilibrium, money supply = money demand. The LM curve summarizes all the combinations of income and interest rates that equate money demand and money supply. It is an upward-sloping relationship between i and Y.

Intuitively, we can explain the upward-sloping LM curve as follows: Let's consider some combination of income and interest rates that equates money demand with the money supply set by the Fed. Now suppose there is an increase in income. The increase in income causes the demand for money to increase. However, money supply is unaffected by the increase in income. The only way that money demand and money supply can be equal again is if interest rates also increase to reduce money demand.
The Aggregate Demand Curve
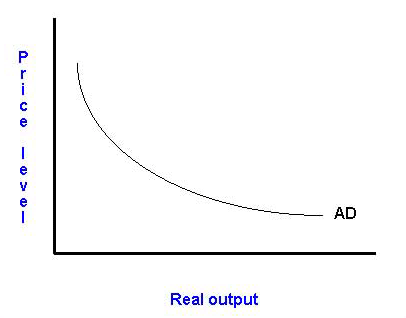
Combining the IS and LM relationships yields the aggregate demand curve, which depicts the inverse relationship between the price level and real income/output, assuming a constant money supply.

For example, a reduction in the price level will:
- Increase the wealth of people holding the fixed quantity of money.
- Reduce the real rate of interest.
- Make domestically produced goods cheaper than those produced abroad.
All these factors will lead to an increase in the quantity of goods and services demanded at the lower price level (movement along the curve).
If you want to change selection, open original toplevel document below and click on "Move attachment"
Summary
| status | not read | reprioritisations | ||
|---|---|---|---|---|
| last reprioritisation on | suggested re-reading day | |||
| started reading on | finished reading on |
Details
Discussion
Do you want to join discussion? Click here to log in or create user.