Do you want BuboFlash to help you learning these things? Or do you want to add or correct something? Click here to log in or create user.
Subject 1. Cost of Capital
#cfa #cfa-level-1 #corporate-finance #cost-of-capital #has-images
Capital is a necessary factor of production, and has a cost. The providers of capital require a return on their money. A firm must ensure that stockholders or those that have lent the firm money (such as banks) receive the return that they require. This return is the cost that the firm will incur to maintain those sources of capital. Therefore, the return that the providers of funds require is equal to the cost to the firm of maintaining those funds.

Calculating the cost of capital is important for a firm, as this is the rate of return that must be used when evaluating capital projects. The return from the project must be greater than the cost of the project in order for it to be acceptable.
In general, a firm can finance its operations from three main sources of capital:
- equity or common stock
- preferred stock
- debt
Each of these sources of capital has a cost. The cost of capital used in capital budgeting should be calculated as a weighted average, or composite, of the various types of funds a firm generally uses.

- The weighted average cost of capital (WACC) is defined as the weighted average cost of the component costs of debt, preferred stock, and common stock or equity. It is also referred to as the marginal cost of capital (MCC), which is the cost of obtaining another dollar of new capital.
- wd = the weight for debt
- wp = the weight for preferred stock
- we = the weight for common stock
- r = required rate for each component
- t = the marginal tax rate
Taxes and the Cost of Capital
Interest on debt is tax deductible; therefore, to calculate the cost of debt, the tax benefit is deducted. This means that after-tax cost of debt = interest rate - tax savings (the government pays part of the cost of debt as interest is tax deductible).
There is no tax savings associated with the use of preferred stock or common stock.
Weights of the Weighted Average
The target capital structure is the percentage of debt, preferred stock, and common equity that a firm is striving to maintain and that will maximize the firm's stock price. Each firm has a target capital structure, and it should raise new capital in a manner that will keep the actual capital structure on target over time.
- If the target capital structure is known, it should be used.
- If not, market values of debt and stocks should be used to calculate weights. That is, the company's current capital structure is assumed to represent the company's target capital structure.
- If this is not possible, then trends in the company's capital structure or averages of comparable companies' capital structures should be used as targets.
Example
Firm A has a capital structure consisting of 40% debt, 5% preferred stock, and 55% common equity (made up of retained earnings and common stock). Firm A pays 10% interest on its debt and has a marginal tax rate of 35%. If Firm A's component cost of preferred stock is 12.5% and the component cost of common stock equity from retained earnings is 13.5%, calculate Firm A's WACC.
WACC = 0.4 x 10% (1 - 0.35) + 0.05 x 12.5% + 0.55 x 13.5% = 0.026 + 0.00625 + 0.07425 = 10.65%
Investment Opportunity Schedule
In any one year, a firm may consider a number of capital projects. The greater the number of projects undertaken, the more money the firm will have to raise in order to finance them.
There is a limit to the amount of money that can be raised in any one year (i.e., the capital markets are finite, and there is a limit to the number of investors and the amount of funds available to invest in any prospect in any given year.) Hence it is important that the capital budgeting analysis be extended to take this fact into account.
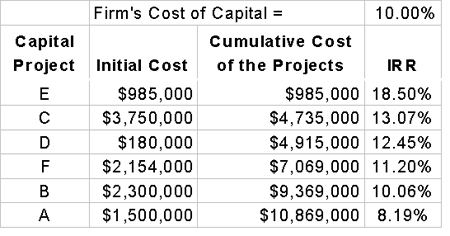
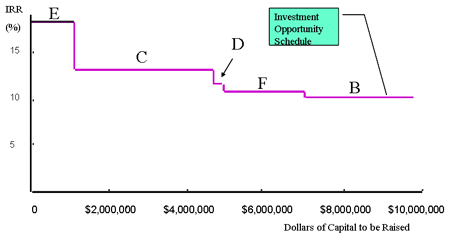
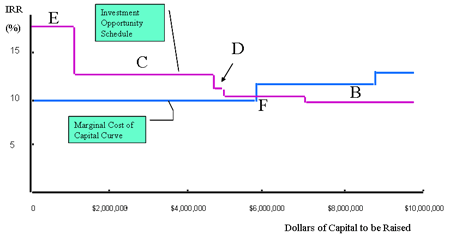
The Investment Opportunity Schedule (IOS) is the prioritized list of capital projects, listed by IRR (internal rate of return) from highest to lowest. The cumulative investment required is also listed.
Example
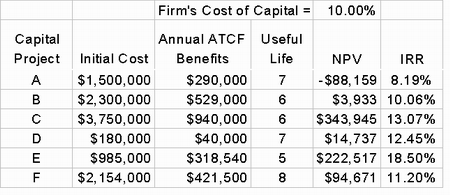
Consider a firm that has six different capital investment proposals this year. Each project has its own IRR and capital cost. Each project has the same risk as the firm as a whole.

The first step in developing an IOS is to order the projects from highest to lowest IRR, and then calculate the cumulative capital cost of the projects.

First, it is clear that project A is unacceptable: it offers a rate of return (IRR) that is less than the firm's cost of capital.
The remaining projects certainly meet the first investment screen (they have positive NPVs; they offer rates of return in excess of the firm's WACC).
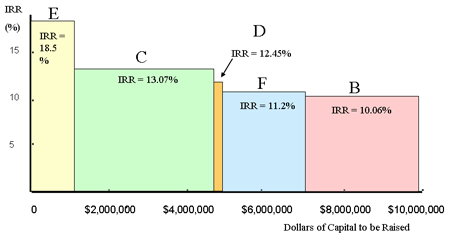
Now a graphical representation of the IOS can be prepared by plotting the projects' IRRs against the cumulative dollars of capital to be raised.

The height of each cylinder is equal to the project's IRR; the width is equal to the initial investment for the project.

As a firm raises more and more capital in any one year, it will exhaust the most readily available (and lowest cost) sources first. If the firm has to raise further capital, it will cost the firm more and the MCC will rise. In this case, project B would definitely be rejected. F is very marginal.

The optimal capital budget is that amount of capital raised and invested at which the MCC = marginal return from investing.
If you want to change selection, open original toplevel document below and click on "Move attachment"
Summary
| status | not read | reprioritisations | ||
|---|---|---|---|---|
| last reprioritisation on | suggested re-reading day | |||
| started reading on | finished reading on |
Details
Discussion
Do you want to join discussion? Click here to log in or create user.