Do you want BuboFlash to help you learning these things? Or do you want to add or correct something? Click here to log in or create user.
Subject 4. Risk Aversion and Portfolio Selection
#cfa #cfa-level-1 #has-images #portfolio-management #risk-and-return-part-i
Risk Aversion
Utility Score = Expected Return - 0.5 x σ2 A


Every investor wants to maximize the investment returns for a given level of risk. Risk refers to the uncertainty of future outcomes. Risk aversion relates to the notion that investors as a rule would rather avoid risk. Given a choice of two investments with equal returns, risk-averse investors will select the investment with lower risk. Investors are risk-averse. Consequently, investors will demand a risk premium for taking on additional levels of risk. The more risk-averse the investor, the more of a premium he or she will demand prior to taking on risk.
Investors who do not demand a premium for risk are said to be risk-neutral (e.g., willing to place both a large and small bet on the flip of a coin and be indifferent) and those investors that enjoy risk are said to be risk seekers (e.g., people who buy lottery tickets despite the knowledge that for every $1 spent, on average they will get less than $0.1 back).
Example
Three investors, Sam, Mike, and Mary are considering two investments: A and B. Investment A is the less risky of the two, requiring an investment of $1,000 with an expected rate of return at 10%. Investment B also requires an investment of $1,000 and has an expected return of 10% but appears to have considerably more variability in potential returns than A. Sam requires a return of 14%, Mike requires 10%, and Mary seeks only an 8% return.
Question: Given the information above, which of the three investors is considered risk-averse?
Solution: Only Sam would be considered risk-averse. He is the only investor who demands a premium of return given the higher risk level. Mike would be considered risk-neutral since he demands no premium in return (despite the higher risk) and Mary would be considered a risk-seeker since she, in fact, will accept less return for a riskier situation.
Risk aversion implies that there is a positive relationship between expected returns (ER) and expected risk (Es), and that the risk return line (CML and SML) is upward-sweeping.
Evidence that suggests that individuals are generally risk-averse:
- Purchase of insurance. Most investors purchase various types of insurance (e.g., life insurance, car insurance, etc.). By buying insurance, an investor avoids the uncertainty of a potential large future cost by paying the current known cost of the insurance policy.
- Difference in the promised yield for different grades of bonds. The promised yield of a bond is its required rate of return. Different grades of bonds have different degrees of credit risk. The promised yield increases as you go from the lowest-risk grade (e.g., AAA) to a grade with higher risk (e.g., AA). That is, as the credit risk of a bond increases, investors will require a higher rate of return.
Utility Theory
Although investors differ in their risk tolerance, they should be consistent in their selection of any portfolio in terms of the risk-return trade-off. Because risk can be quantified as the sum of the variance of the returns over time, it is possible to assign a utility score (aka utility value, utility function) to any portfolio by subtracting its variance from its expected return to yield a number that would be commensurate with an investor's tolerance for risk, or a measure of their satisfaction with the investment. Because risk aversion is not an objectively measurable quantity, there is no unique equation that would yield such a quantity, but an equation can be selected, not for its absolute measure, but for its comparative measure of risk tolerance. One such equation is the following utility formula:
where A is the risk aversion coefficient (a number proportionate to the amount of risk aversion of the investor). It is positive for a risk-averse investor, zero for a risk-neutral investor, and negative for a risk seeker.
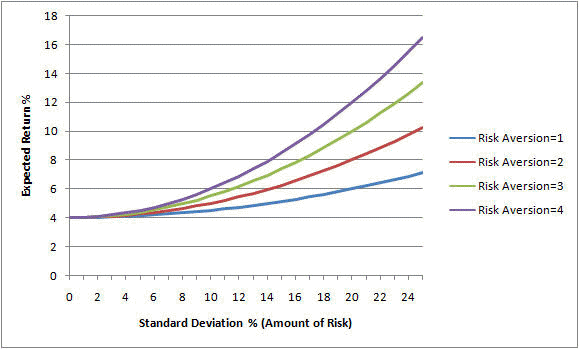
For example, if a T-bill pays 4%, and XYZ stock has a return of 12% and a standard deviation of 25%, and an investor's risk aversion coefficient is 2, his utility score of XYZ stock is equal to: 12% - 0.5 x 0.252 x 2 = 5.75%.
If someone were more risk-averse, we might use 3 instead of 2 to indicate the investor's greater aversion to risk. In this case, the above equation yields: 12% - 0.5 x 252 x 3 = 2.63%.
Since 2.63% is less than the 4% yield of risk-free T-bills, this risk-averse investor will reject XYZ stock in favor of T-bills while the other investor will invest in XYZ stock, since he assigns a utility score of 5.75% to the investment (which is higher than the T-bill yield).
A few conclusions about utility:
- It is unbounded on both sides.
- Higher return contributes to higher utility.
- Higher variance reduces utility.
- Utility does not measure satisfaction. It can be used to rank different investments.
- Utility cannot be compared among individuals; it's a very personal concept.
Indifference Curves
The set of all portfolios with the same utility score plots as an indifference curve.

An investor's indifference curves specify his or her preferences when making risk-return trade-offs. He or she will accept any portfolio with a utility score on his or her risk-indifference curve as being equally acceptable.
- The investments along each curve are equally attractive to the investor.
- The slope of the curves represents how risk-averse the investor is. Steep indifference curves indicate a conservative investor while flat indifference curves indicate a less risk-averse investor.
For a risk-averse investor:
- Every indifference curve runs from the southwest to the northeast.
- Every indifference curve is convex.
- The slope coefficient of an indifference curve is closely related to the risk aversion coefficient.
The Capital Allocation Line
Suppose we construct a portfolio (P) that combines a risky asset i with an expected return of ri and standard deviation of σi, and a riskless asset with a return of rf. Let w1 represent the fraction of the total portfolio value placed in the riskless asset.
- The portfolio return E(rp) is given by E(rp) = w1 rf + (1 - w1) E(ri).
- The portfolio standard deviation is given by σp = (1 - w1) σi
Example
Combine the S&P and a T-bill in a portfolio. E(rS&P) = 13%, σS&P = 20.3%, and rf = 3.8%. Some of the possible portfolios are:
- w1 = 0, E(rp) = E(rS&P) = 13%, and σp = 20.3%.
- w1 = 0.5, E(rp) = 0.5 x 0.038 + 0.5 x 0.13 = 8.4%, and σp = 0.5 x 20.3% = 10.1%.
- w1 = 1, E(rp) = rf) = 3.8%, and σp = 0%.
- w1 = -0.5, E(rp) = -0.5 x 0.038 + 1.5 x 0.13 = 17.6%, and σp = 1.5 x 0.203 = 30.5%. This means there is negative investment in the riskfree asset: the investor borrowed at the risk-free rate. This is called a leveraged position in the risky asset - some of the investment is financed by borrowing.
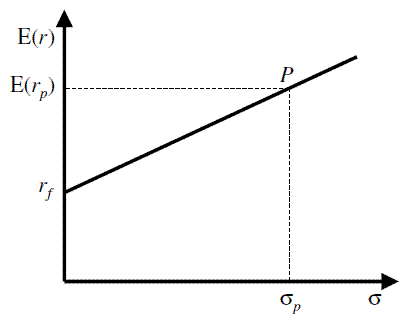
The portfolio's expected return and standard deviation obey a liner relation:


- The slope, [(E(ri - rf)/σi], is known as the portfolio's Sharpe measure or reward-to-variability ratio.
- The intercept is the risk-free rate.
- The line is called the capital allocation line (CAL). When i is a marker index portfolio, the line is called the capital market line (CML).
- A leveraged position is to the right of P.
CAL shows one simple fact: increasing the amount invested in the risky asset increases the expected return by a certain risk premium.
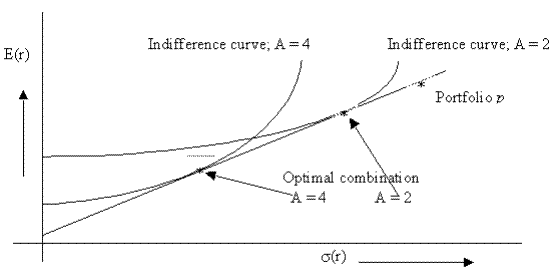
Now the investor must find the point of highest utility on CAL.
The optimal choice for an investor is the point of tangency of the highest indifference curve to the CAL - slope of the indifference curve is equal to the slope of the CAL.

The optimal w1 will be higher for investors with higher A.
If you want to change selection, open original toplevel document below and click on "Move attachment"
Summary
| status | not read | reprioritisations | ||
|---|---|---|---|---|
| last reprioritisation on | suggested re-reading day | |||
| started reading on | finished reading on |
Details
Discussion
Do you want to join discussion? Click here to log in or create user.