Do you want BuboFlash to help you learning these things? Or do you want to add or correct something? Click here to log in or create user.
Subject 4. Applications of the CAPM
#cfa #cfa-level-1 #has-images #portfolio-management #risk-and-return-part-ii
Estimate of Expected Return. Apply the CAPM formula to calculate the expected return of an asset or project.
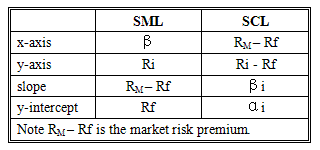
Ri - Rf = αi - βi (Rm - Rf)
If we compare the SML and the SCL:


Portfolio Performance Evaluation. Four ratios are commonly used for this purpose.
- Sharpe Ratio
It is a measure of the excess return per unit of risk. It defined as the portfolio's risk premium divided by its risk: . This ratio is easy to use. The two limitations are:
- It uses standard deviation, not beta, as a measure of volatility.
- The ratio itself is not very informative.
- Treynor Ratio
It measures the excess return on an investment which has no diversifiable risk. Systematic risk is used instead of total risk: . Again, the ratio itself is not very informative, and it cannot be applied to assets with negative βs. It is a ranking criterion which is easy to use.
- M-Squared (M2)
It is a performance measurement using return per unit of total risk as measured by the standard deviation. The investment portfolio's standard deviation is adjusted to reflect the standard deviation of the market benchmark portfolio. The return premiums of the adjusted investment portfolio and the market index portfolio are then compared. - Jensen's Alpha
It is the abnormal return over the theoretical expected return. The theoretical expected return is calculated using CAPM (and beta): α p = Rp - [Rf + β(Rm - Rf)]. Since the CAPM return is supposed to be risk-adjusted, Jensen's α is also risk-adjusted. Investors are constantly seeking investments that have positive α or "abnormal returns."
If an investor holds a portfolio that is not fully diversified, total risk matters. Sharpe ratio and M-squared are appropriate performance measures in such cases. On the other hand, if the portfolio is well-diversified, Treynor ratio and Jensen's alpha are relevant, as only the systematic risk of the portfolio matters.
Security Characteristic Line. A security characteristic line (SCL) graphs the relationship between the excess market return and excess security return.

While there is only one SML, there are many different SCLs for securities with different betas.
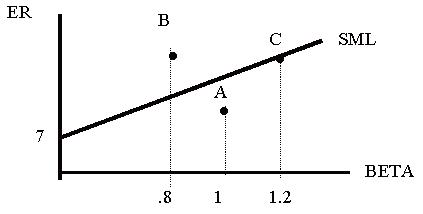
Security Selection. Overvalued and undervalued securities are those securities that do not lie on the SML line. By definition, securities that are efficiently priced should fall directly on the (calculated) SML line. If a security is above the line it is deemed undervalued since it is providing more expected return than what is demanded for that risk level. Securities falling below the SML line, on the other hand, provides less return than the market demands. Securities that fall below the SML are considered overvalued. In the former case, the security price will be bid up, such that the expected return declines and the security falls back to the SML line. In a situation where the security is overvalued, the security price declines until the expected return rises.

All assets and all portfolios should plot on the SML.
- Stock C has an estimated rate of return equal to its systematic risk or required rate of return.
- Stock B is expected to provide a rate of return above the required rate of return.
- Stock A is expected to provide a rate of return below the required rate of return.
- Investors should buy B (undervalued).
- Investors should sell A (overvalued).
Constructing a Portfolio

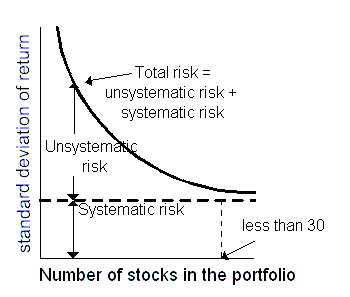
As the number of securities increases, the portfolio manager can eliminate unsystematic risk (or diversifiable risk) and focus on systematic or undiversifiable risk. As you can see, much of the unsystematic risk can be diversified away in as few as 30 securities.
To construct a market portfolio you can start with a portfolio of securities like the S&P 500. You can then evaluate the α of any security, using the CAPM and the S&P 500 as the market portfolio. If the α is positive, add the security to the portfolio. If a security's α is negative and it is already included in the portfolio, remove it. You can also use the information ratio of each individual security to determine the relative weight of the security in the portfolio.
If you want to change selection, open original toplevel document below and click on "Move attachment"
Summary
| status | not read | reprioritisations | ||
|---|---|---|---|---|
| last reprioritisation on | suggested re-reading day | |||
| started reading on | finished reading on |
Details
Discussion
Do you want to join discussion? Click here to log in or create user.