Do you want BuboFlash to help you learning these things? Or do you want to add or correct something? Click here to log in or create user.
Subject 2. Basic Principles and Concepts
#cfa #cfa-level-1 #economics #has-images #microeconomics #reading-13-demand-and-supply-analysis-introduction
The Demand Function and the Demand Curve


B. A decrease in taxes levied on the good produced in the market
C. An increase in the price of the good produced in the market
D. An increase in the cost of producing this good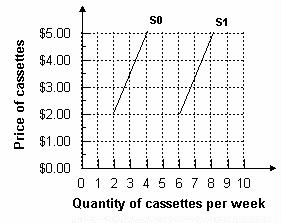
The demand function represents buyers' behavior.

Prices influence consumers' purchase decisions. The demand function can be depicted as a negatively sloped demand curve.
- If all other factors are equal, as the price of a good rises, consumer demand falls. This is mainly due to the availability of substitutes, which are goods that perform similar functions.
- As the price of a good falls, consumer demand rises.
Therefore, there is an inverse relationship between the price of a good and the amount that consumers are willing to buy. The demand curve normally slopes downward. It tells the analyst the quantity that consumers are willing to buy for each possible price when all other influences on consumers' planned purchases remain the same.
Example 1
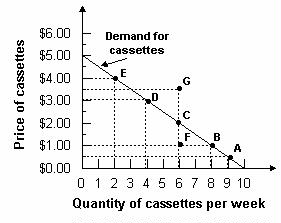
Refer to the graph below. What is the quantity of cassettes demanded when their price is $4.00 per week?

Answer: Two cassettes per week. The demand curve tells how much is demanded at each price. To determine the quantity demanded, find $4.00 on the vertical axis and read across until you meet the demand curve. Then read the quantity from the horizontal axis.
When any factor that influences buying plans, other than the price of the good, changes, there is a change in demand for that good. When the quantity of the good that people plan to buy changes at each and every price, there is a new demand curve. These factors include changes in income, number of consumers in the market, changes in the price of a related good, etc.
Example 2
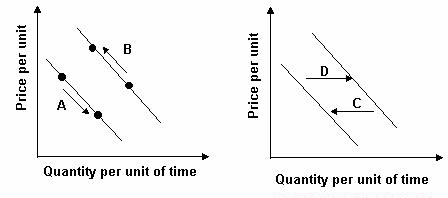
Assume the graph below reflects demand in the automobile market. Which arrow best captures the impact of increased consumer income on the automobile market?

Answer: D. Income is a shift factor of demand. An increase in income increases the number of automobiles demanded at each price. Therefore demand has shifted to the right.
- When demand increases, the quantity that people plan to buy increases at each and every price, so the demand curve shifts rightward.
- When demand decreases, the quantity that people plan to buy decreases at each and every price, so the demand curve shifts leftward.
A Change in the Quantity Demanded Versus a Change in Demand
The demand curve isolates the impact of price on the amount of a product purchased.
- A change in quantity demanded (caused by price change ONLY) is a movement along a demand curve from one point to another.
- Changes in other factors (anything other than price), such as income, tastes, expectations, and the prices of closely related goods, will shift the entire demand curve inwards or outwards. This is referred to as change in demand.
Example 3
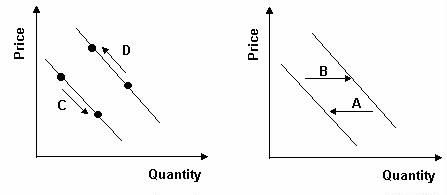
Refer to the graph below. Consumers began purchasing more of a product due to a decrease in price. Which arrow best represents this statement?

Answer: C. A change in price causes a movement along the demand curve. When price falls, the movement is downward and to the right.
The Supply Function and the Supply Curve
Resources and technology determine what it is possible to produce. Supply reflects a decision about which technologically feasible items are best to produce. The supply function represents sellers' behavior.

Prices influence producers' supply decisions. The supply function can be depicted as a positively sloped supply curve.
- If all other factors are equal, a higher price will increase the producer's incentive to supply the good. Higher prices increase the producer's profit, which is the excess of sales revenue over the cost of production.
- As the price of a good falls, its supply falls as well.
Therefore, there is a direct relationship between the price of a good and the amount of that good that will be supplied. The supply curve slopes upward. It tells the analyst the quantity that producers are willing to supply for each price when all other influences on producers' planned sales remain the same.
Example 4
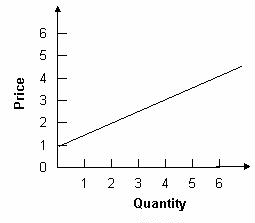
The graph below displays the quantity associated with price in a supply table.

To find the quantity supplied at a price of $1, extend a horizontal line from $1 to the supply curve and drop a vertical line down to the quantity axis. These lines will intersect at 0. This is the quantity that will be associated with a price of $1 on a supply table.
The law of supply results from the general tendency for the marginal cost of producing a good or service to increase as the quantity produced increases.
A supply curve is also a minimum-supply-price curve. The greater the quantity produced, the higher the price a firm must be offered to be willing to produce that quantity.
A Change in Supply
Changes in other factors will influence the amount of products that producers are willing to supply. These factors include the prices of productive resources, expected future prices, number of suppliers, taxes, etc.
These factors affect the opportunity cost of supplying a good, and are held constant when drawing a supply curve. Changes in these factors will shift the entire supply curve for the good.
Example 5
Refer to the graph below. A shift from S1 to S0 would most likely occur for what reason?
A. An increase in the number of suppliers in the market
B. A decrease in taxes levied on the good produced in the market
C. An increase in the price of the good produced in the market
D. An increase in the cost of producing this good

Answer: D. An increase in the cost of producing the good causes supply to shift leftward. An increase in the number of firms and a decrease in taxes cause supply to shift rightward. A change in price causes a movement along supply, not a shift.
A Change in the Quantity Supplied Versus a Change in Supply
The quantity supplied of a good or service is the amount that producers plan to sell during a given time period at a particular price.
Price is just one of the factors that affect producers' supply decisions. The supply curve isolates the impact of price on the quantity of a product supplied and assumes that all other factors stay the same.
- A change in quantity supplied is caused by a price change ONLY. It is a movement along the same supply curve.
- When one of the other factors that influence selling plans changes, there is a change in supply and a shift of the supply curve.
Example 6
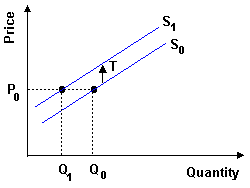
A tax will shift the supply curve up by the amount of the tax.

At every price level, less is supplied. For example, at price P0, originally Q0 is supplied. After the tax, Q1 is supplied at price P0.
If you want to change selection, open original toplevel document below and click on "Move attachment"
Summary
| status | not read | reprioritisations | ||
|---|---|---|---|---|
| last reprioritisation on | suggested re-reading day | |||
| started reading on | finished reading on |
Details
Discussion
Do you want to join discussion? Click here to log in or create user.