Do you want BuboFlash to help you learning these things? Or do you want to add or correct something? Click here to log in or create user.
Exhibit 2. An indifference curve
#cfa #cfa-level-1 #economics #has-images #microeconomics #reading-14-demand-and-supply-analysis-consumer-demand #section-3-utility-theory #study-session-4
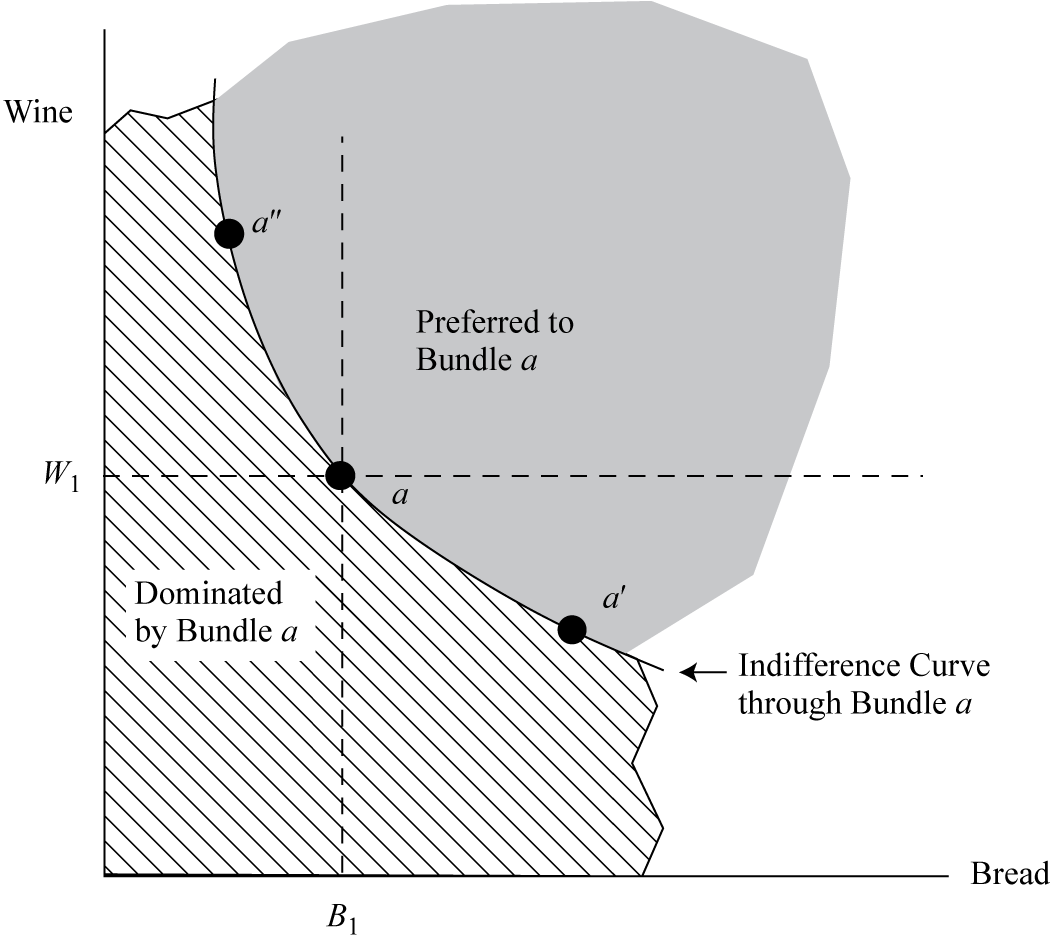
To determine our consumer’s preferences, we present a choice between bundle aand bundle a′, which contains more bread but less wine than a.
We need to ask the consumer which one he prefers. If he prefers a′, then we would remove a little bread and ask again. If he strictly prefers a, then we would add a little bread, and so on, until we could find just the right combination that the new bundle a′ would be equally satisfying (indifferent) to our consumer as bundle a.
We would then choose a bundle, say a′′, that contains more wine and less bread than bundle a, and we would again adjust the goods until they are indifferent.
By continuing to choose bundles and make adjustments, it would be possible to identify all possible bundles such that the consumer is just indifferent among each of them and bundle a.
Such a set of points is represented in Exhibit 2, where the indifference curve through point a represents that set of bundles.
Notice that the “preferred-to-bundle-a” set has expanded to include all bundles that lie in the region above and to the right of the indifference curve. Correspondingly, the “dominated-by-bundle-a” set has expanded to include all bundles that lie in the region below and to the left of the indifference curve.
If you want to change selection, open original toplevel document below and click on "Move attachment"
Summary
| status | not read | reprioritisations | ||
|---|---|---|---|---|
| last reprioritisation on | suggested re-reading day | |||
| started reading on | finished reading on |
Details
Discussion
Do you want to join discussion? Click here to log in or create user.