Do you want BuboFlash to help you learning these things? Or do you want to add or correct something? Click here to log in or create user.
6.1. Consumer’s Demand Curve from Preferences and Budget Constraints
#6-revisiting-demand-function #cfa #cfa-level-1 #economics #has-images #microeconomics #reading-14-demand-and-supply-analysis-consumer-demand #study-session-4
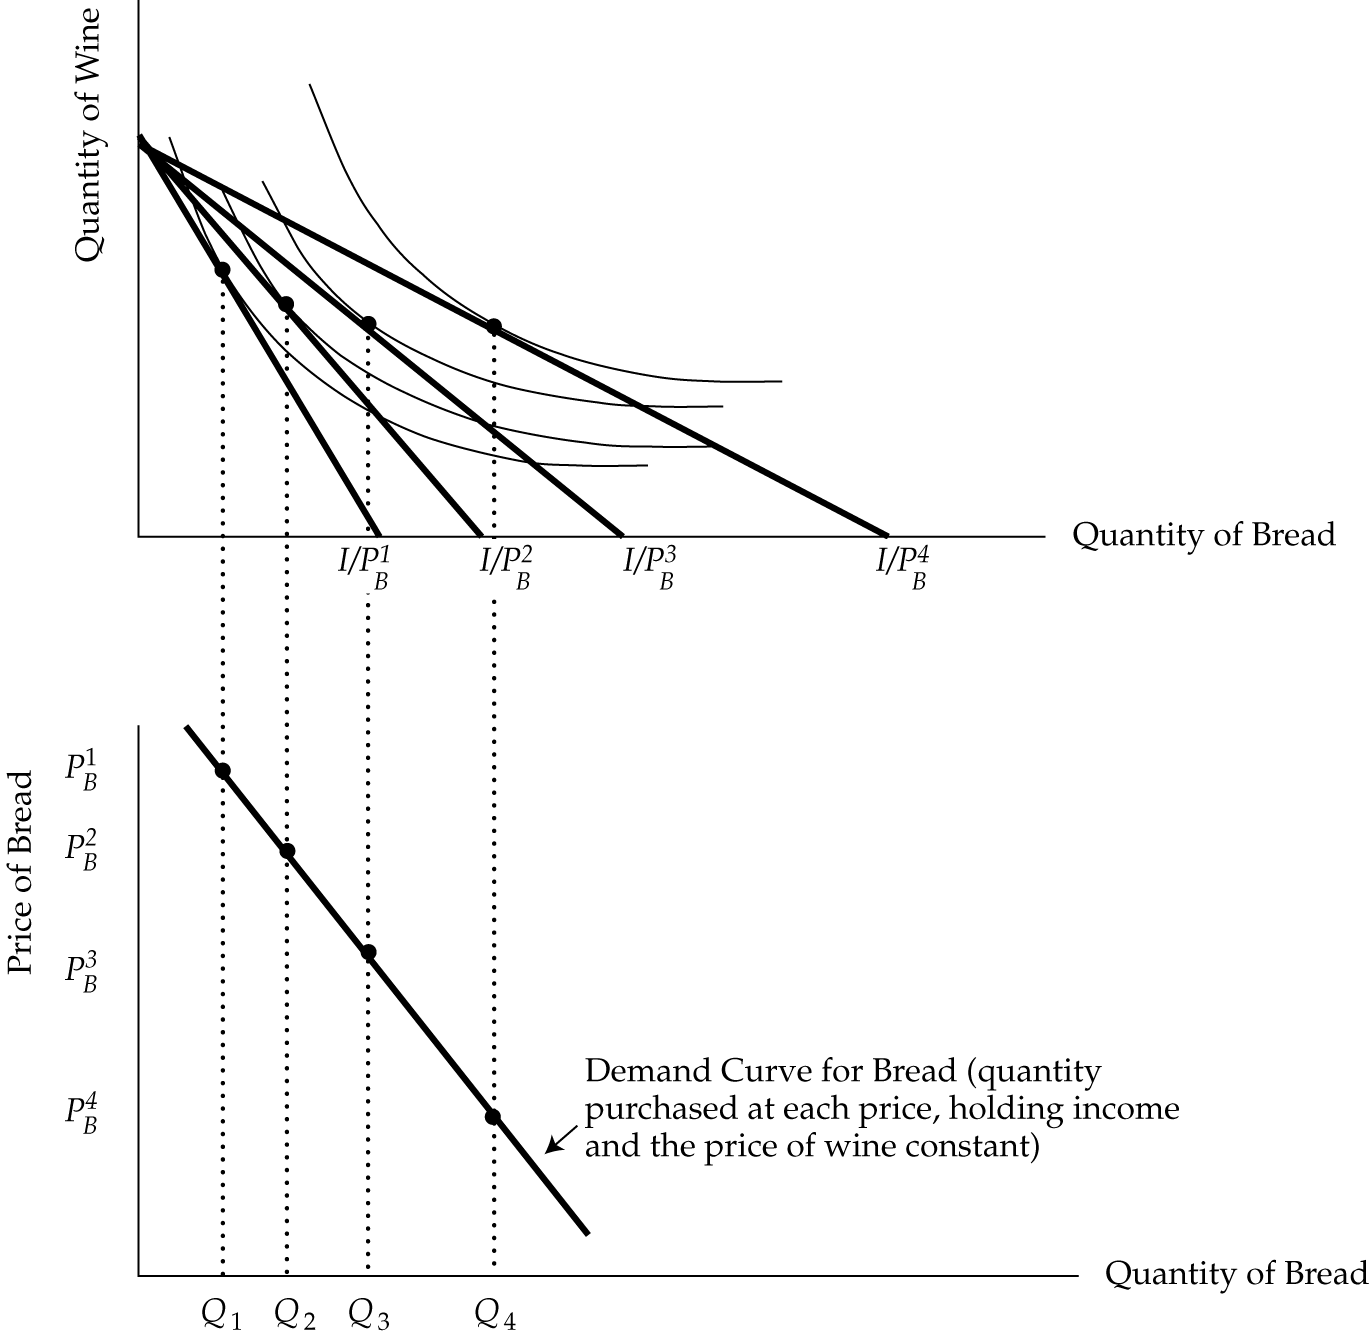
Recall that to draw a consumer’s demand curve, we appealed to the assumption of “holding all other things constant” and held preferences, income, and the prices of all but one good constant. Graphically, we show such an exercise by representing a given utility function with a set of indifference curves, and then we superimpose a set of budget constraints, each one representing a different price of one of the goods. Exhibit 15 shows the result of this exercise. Notice that we are “stacking” two exhibits vertically to show both the indifference curves and budget constraints and the demand curve below them. In the upper exhibit, we have rotated the budget constraint rightward, indicating successively lower prices of bread, P1B , P2B , P3B , P4B , while holding income constant at I.
If you want to change selection, open original toplevel document below and click on "Move attachment"
Summary
| status | not read | reprioritisations | ||
|---|---|---|---|---|
| last reprioritisation on | suggested re-reading day | |||
| started reading on | finished reading on |
Details
Discussion
Do you want to join discussion? Click here to log in or create user.