Do you want BuboFlash to help you learning these things? Or do you want to add or correct something? Click here to log in or create user.
#cfa-level-1 #economics #has-images #microeconomics #reading-15-demand-and-supply-analysis-the-firm #section-3-analysis-of-revenue-costs-and-profit #study-session-4
The production function has three distinct regions where both the direction of change and the rate of change in total product (TP or Q, quantity of output) vary as production changes. Regions 1 and 2 have positive changes in TP as labor is added, but the change turns negative in Region 3.
If you want to change selection, open document below and click on "Move attachment"
Open it
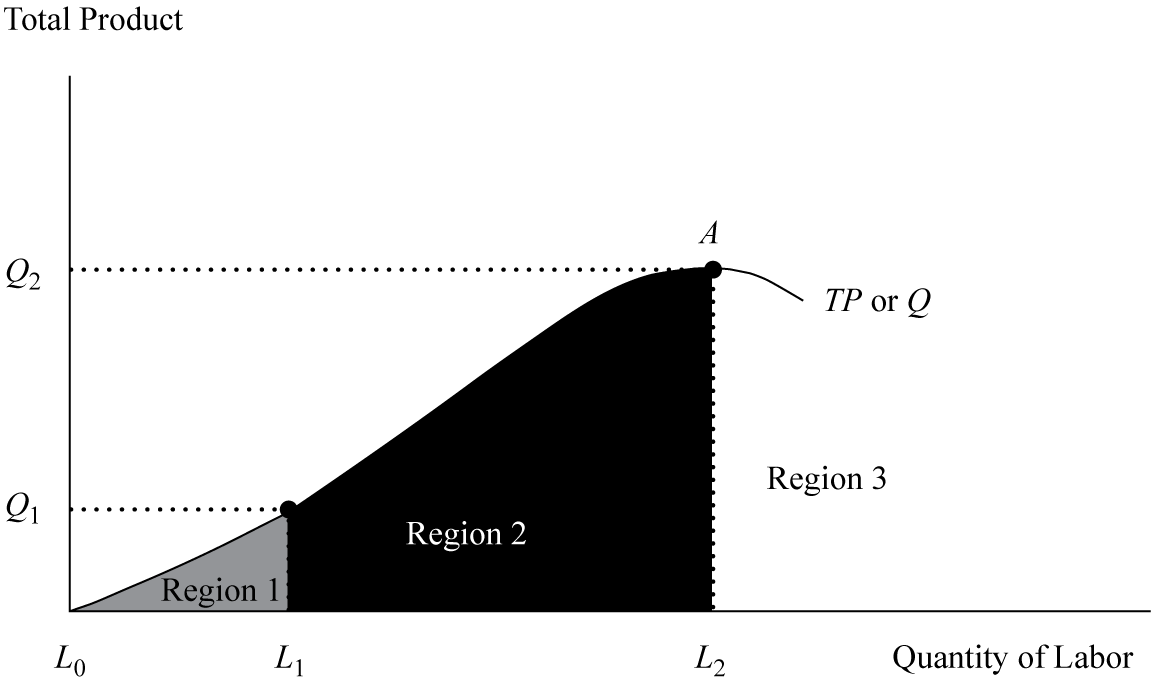
This image illustrates the shape of a typical input–output relationship using labor (L) as the only variable input (all other input factors are held constant). The production function has three distinct regions where both the direction of change and the rate of change in total product (TP or Q, quantity of output) vary as production changes. Regions 1 and 2 have positive changes in TP as labor is added, but the change turns negative in Region 3. Moreover, in Region 1 (L 0 – L 1 ), TP is increasing at an increasing rate, ty
Open it
This image illustrates the shape of a typical input–output relationship using labor (L) as the only variable input (all other input factors are held constant). The production function has three distinct regions where both the direction of change and the rate of change in total product (TP or Q, quantity of output) vary as production changes. Regions 1 and 2 have positive changes in TP as labor is added, but the change turns negative in Region 3. Moreover, in Region 1 (L 0 – L 1 ), TP is increasing at an increasing rate, ty
Summary
| status | not read | reprioritisations | ||
|---|---|---|---|---|
| last reprioritisation on | suggested re-reading day | |||
| started reading on | finished reading on |
Details
Discussion
Do you want to join discussion? Click here to log in or create user.