Do you want BuboFlash to help you learning these things? Or do you want to add or correct something? Click here to log in or create user.
#cfa #cfa-level-1 #economics #has-images #reading-15-demand-and-supply-analysis-the-firm #section-3-analysis-of-revenue-costs-and-profit
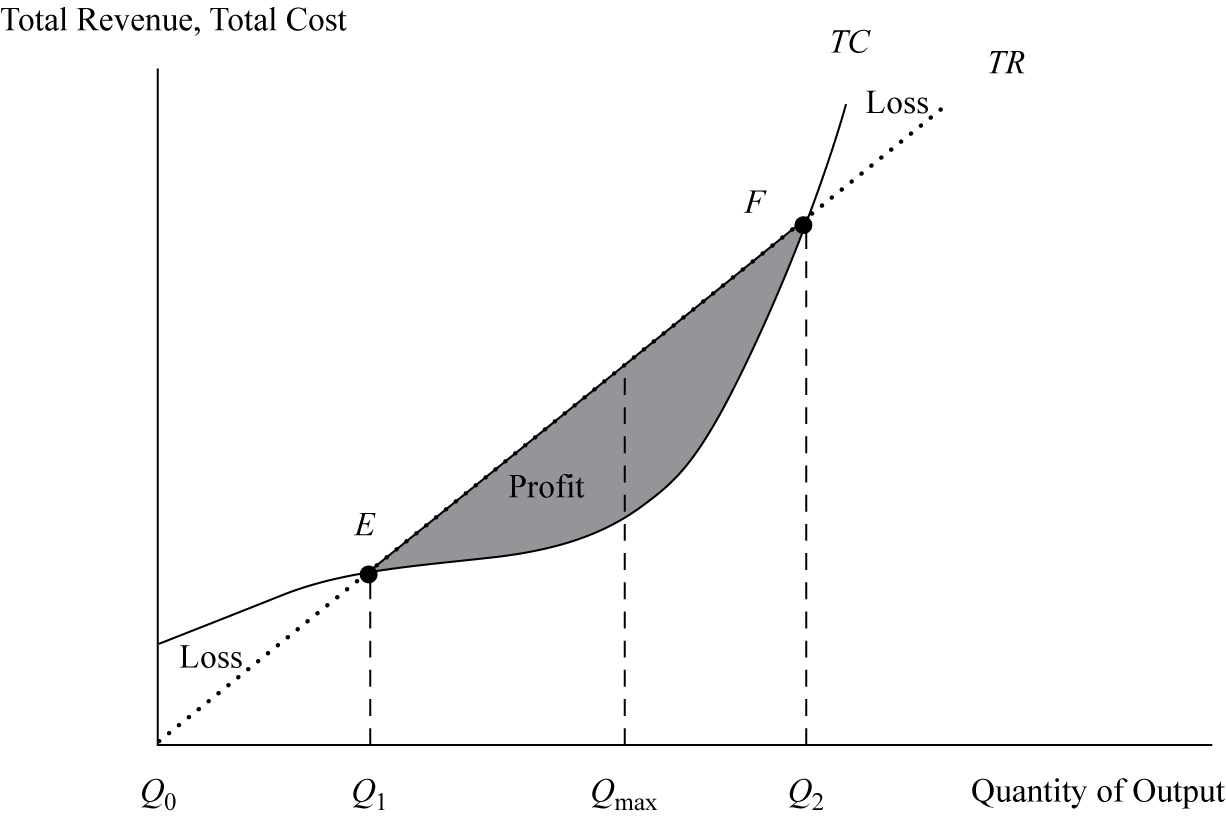
Exhibit 18 shows the breakeven point under perfect competition using the total revenue–total cost approach. Actually, there are two breakeven points—lower (point E) and upper (point F). Below point E, the firm is losing money (economic losses), and beyond that point is the region of profitability (shaded area) that extends to the upper breakeven point. Within this profit area, a specific quantity (Qmax) maximizes profit as the largest difference between TR and TC. Point F is where the firm leaves the profit region and incurs economic losses again. This second region of economic losses develops when the firm’s production begins to reach the limits of physical capacity, resulting in diminished productivity and an acceleration of costs. Obviously, the firm would not produce beyond Qmax because it is the optimal production point that maximizes profit.
Breakeven points, profit regions, and economic loss ranges are influenced by demand and supply conditions, which change frequently according to the market behavior of consumers and firms. A high initial breakeven point is riskier than a low point because it takes a larger volume and, usually, a longer time to reach. However, at higher output levels it yields more return in compensation for this greater risk.
Breakeven points, profit regions, and economic loss ranges are influenced by demand and supply conditions, which change frequently according to the market behavior of consumers and firms. A high initial breakeven point is riskier than a low point because it takes a larger volume and, usually, a longer time to reach. However, at higher output levels it yields more return in compensation for this greater risk.
If you want to change selection, open original toplevel document below and click on "Move attachment"
Summary
| status | not read | reprioritisations | ||
|---|---|---|---|---|
| last reprioritisation on | suggested re-reading day | |||
| started reading on | finished reading on |
Details
Discussion
Do you want to join discussion? Click here to log in or create user.