Do you want BuboFlash to help you learning these things? Or do you want to add or correct something? Click here to log in or create user.
If you want to change selection, open original toplevel document below and click on "Move attachment"
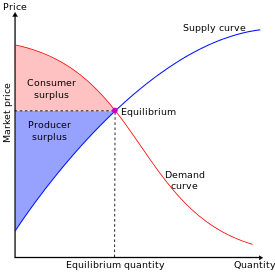
Graph illustrating consumer (red) and producer (blue) surpluses on a supply and demand chart.
From Wikipedia, the free encyclopedia Jump to: navigation, search This article is about consumers' and producers' surplus. For information about other surpluses, see Surplus. <span>Graph illustrating consumer (red) and producer (blue) surpluses on a supply and demand chart In mainstream economics, economic surplus, also known as total welfare or Marshallian surplus (named after Alfred Marshall), refers to two related quantities. Consumer surplus or consume
Parent (intermediate) annotation
Open itGraph illustrating consumer (red) and producer (blue) surpluses on a supply and demand chart.
Original toplevel document
Economic surplus - Wikipedia, the free encyclopediaFrom Wikipedia, the free encyclopedia Jump to: navigation, search This article is about consumers' and producers' surplus. For information about other surpluses, see Surplus. <span>Graph illustrating consumer (red) and producer (blue) surpluses on a supply and demand chart In mainstream economics, economic surplus, also known as total welfare or Marshallian surplus (named after Alfred Marshall), refers to two related quantities. Consumer surplus or consume
Summary
| status | not learned | measured difficulty | 37% [default] | last interval [days] | |||
|---|---|---|---|---|---|---|---|
| repetition number in this series | 0 | memorised on | scheduled repetition | ||||
| scheduled repetition interval | last repetition or drill |
Details
No repetitionsDiscussion
Do you want to join discussion? Click here to log in or create user.
