Do you want BuboFlash to help you learning these things? Or do you want to add or correct something? Click here to log in or create user.
Tags
#has-images
Question
Sixty two percent of 12 th graders attend school in a particular urban school district. If a sample of 500 12 th grade children is selected from the district, find the probability that at least 290 are actually enrolled in that school.

Answer
1.Determine if you can use the normal distribution: n × p = 500 × .62 = 310 n × q = 500 × .38 = 190 These are both larger than 5, so we can use the normal approximation.
2.Find the mean, μ = n × p = 310
3.then µ x q: 310 × .38 = 117.8
4. σ = √(µ x q) = √117.8 = 10.85
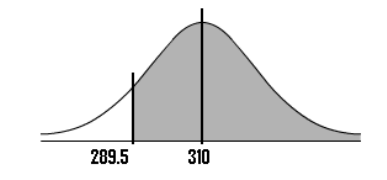
5. P (X ≥ 290) using Continuity Correction Factor” = P (X > 289.5)
6. Z-value = (n-μ)/σ = (289.5 – 310) / 10.85 = -1.89
7. The area for -1.819 is .4706 in the z-table
8. Add .5 or substract from .5 depending on which area you are looking for (see image below) => P= .9706, or 97.06%.
Tags
#has-images
Question
Sixty two percent of 12 th graders attend school in a particular urban school district. If a sample of 500 12 th grade children is selected from the district, find the probability that at least 290 are actually enrolled in that school.
Answer
?
Tags
#has-images
Question
Sixty two percent of 12 th graders attend school in a particular urban school district. If a sample of 500 12 th grade children is selected from the district, find the probability that at least 290 are actually enrolled in that school.

Answer
1.Determine if you can use the normal distribution: n × p = 500 × .62 = 310 n × q = 500 × .38 = 190 These are both larger than 5, so we can use the normal approximation.
2.Find the mean, μ = n × p = 310
3.then µ x q: 310 × .38 = 117.8
4. σ = √(µ x q) = √117.8 = 10.85
5. P (X ≥ 290) using Continuity Correction Factor” = P (X > 289.5)
6. Z-value = (n-μ)/σ = (289.5 – 310) / 10.85 = -1.89
7. The area for -1.819 is .4706 in the z-table
8. Add .5 or substract from .5 depending on which area you are looking for (see image below) => P= .9706, or 97.06%.
2.Find the mean, μ = n × p = 310
3.then µ x q: 310 × .38 = 117.8
4. σ = √(µ x q) = √117.8 = 10.85
5. P (X ≥ 290) using Continuity Correction Factor” = P (X > 289.5)
6. Z-value = (n-μ)/σ = (289.5 – 310) / 10.85 = -1.89
7. The area for -1.819 is .4706 in the z-table
8. Add .5 or substract from .5 depending on which area you are looking for (see image below) => P= .9706, or 97.06%.
If you want to change selection, open document below and click on "Move attachment"
pdf
owner: naxplast06 - (no access) - Deviant S. - The Practically Cheating Statistics Handbook (2010, CreateSpace Independent Publishing Platform).pdf, p81
Summary
| status | not learned | measured difficulty | 37% [default] | last interval [days] | |||
|---|---|---|---|---|---|---|---|
| repetition number in this series | 0 | memorised on | scheduled repetition | ||||
| scheduled repetition interval | last repetition or drill |
Details
No repetitionsDiscussion
Do you want to join discussion? Click here to log in or create user.