Do you want BuboFlash to help you learning these things? Or do you want to add or correct something? Click here to log in or create user.
Tags
#has-images
Question
How do you find a probability that a variable is greater than a certain value, less than a certain value, or between two values using the central limit theorem?
Answer
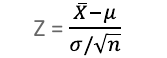
1. Use the formula in image to find Z-value
2. Find areas under the curve for the different Z-values of interest.
3. Add or subtract areas as needed
2. Find areas under the curve for the different Z-values of interest.
3. Add or subtract areas as needed
Tags
#has-images
Question
How do you find a probability that a variable is greater than a certain value, less than a certain value, or between two values using the central limit theorem?
Answer
?
Tags
#has-images
Question
How do you find a probability that a variable is greater than a certain value, less than a certain value, or between two values using the central limit theorem?
Answer
1. Use the formula in image to find Z-value
2. Find areas under the curve for the different Z-values of interest.
3. Add or subtract areas as needed
2. Find areas under the curve for the different Z-values of interest.
3. Add or subtract areas as needed
If you want to change selection, open document below and click on "Move attachment"
pdf
owner: naxplast06 - (no access) - Deviant S. - The Practically Cheating Statistics Handbook (2010, CreateSpace Independent Publishing Platform).pdf, p104
Summary
| status | not learned | measured difficulty | 37% [default] | last interval [days] | |||
|---|---|---|---|---|---|---|---|
| repetition number in this series | 0 | memorised on | scheduled repetition | ||||
| scheduled repetition interval | last repetition or drill |
Details
No repetitionsDiscussion
Do you want to join discussion? Click here to log in or create user.