Another useful pattern while reading papers is Ankifying figures. For instance, here's a graph from Jones 2011 showing the probability a physicist made their prizewinning discovery by age 40 (blue line) and by age 30 (black line):
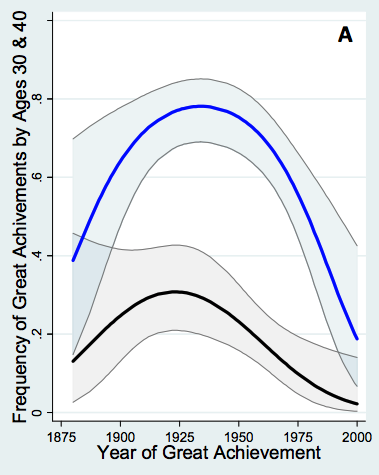
I have an Anki question which simply says: “Visualize the graph Jones 2011 made of the probability curves for physicists making their prizewinning discoveries by age 30 and 40”. The answer is the image shown above, and I count myself as successful if my mental image is roughly along those lines. I could deepen my engagement with the graph by adding questions such as: “In Jones 2011's graph of physics prizewinning discoveries, what is the peak probability of great achievement by age 40 [i.e., the highest point in the blue line in the graph above]?” (Answer: about 0.8.) Indeed, one could easily add dozens of interesting questions about this graph. I haven't done that, because of the time commitment associated to such questions. But I do find the broad shape of the graph fascinating, and it's also useful to know the graph exists, and where to consult it if I want more details.
Augmenting Long-term Memory
for this particular paper, I'm not too worried about such issues. And so I didn't Ankify any such question. But it's worth being careful in framing questions so you're not misleading yourself. <span>Another useful pattern while reading papers is Ankifying figures. For instance, here's a graph from Jones 2011 showing the probability a physicist made their prizewinning discovery by age 40 (blue line) and by age 30 (black line): I have an Anki question which simply says: “Visualize the graph Jones 2011 made of the probability curves for physicists making their prizewinning discoveries by age 30 and 40”. The answer is the image shown above, and I count myself as successful if my mental image is roughly along those lines. I could deepen my engagement with the graph by adding questions such as: “In Jones 2011's graph of physics prizewinning discoveries, what is the peak probability of great achievement by age 40 [i.e., the highest point in the blue line in the graph above]?” (Answer: about 0.8.) Indeed, one could easily add dozens of interesting questions about this graph. I haven't done that, because of the time commitment associated to such questions. But I do find the broad shape of the graph fascinating, and it's also useful to know the graph exists, and where to consult it if I want more details. I said above that I typically spend 10 to 60 minutes Ankifying a paper, with the duration depending on my judgment of the value I'm getting from the paper. However, if I'm learning a gr
Summary
| status | not read | reprioritisations | ||
|---|---|---|---|---|
| last reprioritisation on | suggested re-reading day | |||
| started reading on | finished reading on |