Do you want BuboFlash to help you learning these things? Or do you want to add or correct something? Click here to log in or create user.
#has-images


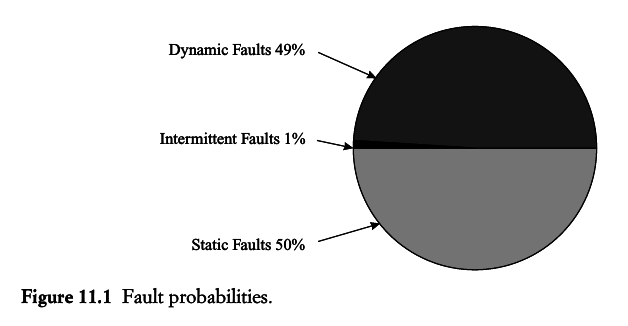
The relative probabilities of faults that appear during tests in manufacturing are shown in Figure 11.1. Dynamic faults may be further divided into timing faults (28%) and driver faults (21%). Timing faults and intermittent faults may be due to poor design. It is difficult to design test strategies for such faults.
If you want to change selection, open original toplevel document below and click on "Move attachment"
Summary
| status | not read | reprioritisations | ||
|---|---|---|---|---|
| last reprioritisation on | suggested re-reading day | |||
| started reading on | finished reading on |
Details
Discussion
Do you want to join discussion? Click here to log in or create user.