Edited, memorised or added to reading queue
on 01-Jul-2022 (Fri)
Do you want BuboFlash to help you learning these things? Click here to log in or create user.
Flashcard 7101870378252
| status | not learned | measured difficulty | 37% [default] | last interval [days] | |||
|---|---|---|---|---|---|---|---|
| repetition number in this series | 0 | memorised on | scheduled repetition | ||||
| scheduled repetition interval | last repetition or drill |
Parent (intermediate) annotation
Open itdata, it is unrealistic to assume that the treatment groups are exchangeable. In other words, there is no reason to expect that the groups are the same in all relevant variables other than the <span>treatment. <span>
Original toplevel document (pdf)
cannot see any pdfsFlashcard 7101872475404
| status | not learned | measured difficulty | 37% [default] | last interval [days] | |||
|---|---|---|---|---|---|---|---|
| repetition number in this series | 0 | memorised on | scheduled repetition | ||||
| scheduled repetition interval | last repetition or drill |
Parent (intermediate) annotation
Open itWe denote by 𝑌(1) the potential outcome of happiness you would observe if you were to get a dog ( 𝑇 = 1 )
Original toplevel document (pdf)
cannot see any pdfsFlashcard 7101874048268
| status | not learned | measured difficulty | 37% [default] | last interval [days] | |||
|---|---|---|---|---|---|---|---|
| repetition number in this series | 0 | memorised on | scheduled repetition | ||||
| scheduled repetition interval | last repetition or drill |
Parent (intermediate) annotation
Open itlly estimate quantities such as 𝔼 𝑋 [ 𝔼[𝑌 | 𝑇 = 1, 𝑋] − 𝔼[𝑌 | 𝑇 = 0, 𝑋] ] ? We will often use a model (e.g. linear regression or some more fancy predictor from machine learning) in place of the <span>conditional expectations 𝔼[𝑌 | 𝑇 = 𝑡, 𝑋 = 𝑥] . We will refer to estimators that use models like this as model-assisted estimators. Now that we’ve gotten some of this terminology out of the way, we can proceed t
Original toplevel document (pdf)
cannot see any pdfsFlashcard 7101875883276
| status | not learned | measured difficulty | 37% [default] | last interval [days] | |||
|---|---|---|---|---|---|---|---|
| repetition number in this series | 0 | memorised on | scheduled repetition | ||||
| scheduled repetition interval | last repetition or drill |
Parent (intermediate) annotation
Open itcal Markov assumption would tell us that we can factorize 𝑃(𝑥, 𝑦) as 𝑃(𝑥)𝑃(𝑦|𝑥) , but it would also allow us to factorize 𝑃(𝑥, 𝑦) as 𝑃(𝑥)𝑃(𝑦) , meaning it allows distributions where 𝑋 and 𝑌 are <span>independent. In contrast, the minimality assumption does not allow this additional independence <span>
Original toplevel document (pdf)
cannot see any pdfsFlashcard 7101877718284
| status | not learned | measured difficulty | 37% [default] | last interval [days] | |||
|---|---|---|---|---|---|---|---|
| repetition number in this series | 0 | memorised on | scheduled repetition | ||||
| scheduled repetition interval | last repetition or drill |
Parent (intermediate) annotation
Open itThe causal graph for interventional distributions is simply the same graph that was used for the observational joint distribution, but with all of the edges to the intervened node(s) removed.
Original toplevel document (pdf)
cannot see any pdfsFlashcard 7101880077580
| status | not learned | measured difficulty | 37% [default] | last interval [days] | |||
|---|---|---|---|---|---|---|---|
| repetition number in this series | 0 | memorised on | scheduled repetition | ||||
| scheduled repetition interval | last repetition or drill |
Parent (intermediate) annotation
Open itRather, my outcome is only a function of my own treatment. We’ve been using this assumption implicitly throughout this chapter. We’ll now formalize it. Assumption 2.4 (No Interference) 𝑌 𝑖 (𝑡 1 , . . . , 𝑡 𝑖−1 , 𝑡 𝑖 , 𝑡 𝑖+1 , . . . , 𝑡 𝑛 ) = 𝑌
Original toplevel document (pdf)
cannot see any pdfs| status | not read | reprioritisations | ||
|---|---|---|---|---|
| last reprioritisation on | suggested re-reading day | |||
| started reading on | finished reading on |
Parent (intermediate) annotation
Open itGenerating synthetic time-series and sequential data is more challenging than tabular data where normally all the information regarding one individual is stored in a single row. In sequential data, information can be spread through many rows, like credit card transactions, and preservation of correlations between rows — the events — and columns — the variables is key. Furthermore, the length of the sequences is variable; some cases may comprise just a few transactions while others may have thousands.
Original toplevel document (pdf)
cannot see any pdfsFlashcard 7101883747596
| status | not learned | measured difficulty | 37% [default] | last interval [days] | |||
|---|---|---|---|---|---|---|---|
| repetition number in this series | 0 | memorised on | scheduled repetition | ||||
| scheduled repetition interval | last repetition or drill |
Parent (intermediate) annotation
Open itWhen we say “identification” in this book, we are referring to the process of moving from a causal estimand to an equivalent statistical estimand
Original toplevel document (pdf)
cannot see any pdfsFlashcard 7101885582604
| status | not learned | measured difficulty | 37% [default] | last interval [days] | |||
|---|---|---|---|---|---|---|---|
| repetition number in this series | 0 | memorised on | scheduled repetition | ||||
| scheduled repetition interval | last repetition or drill |
Parent (intermediate) annotation
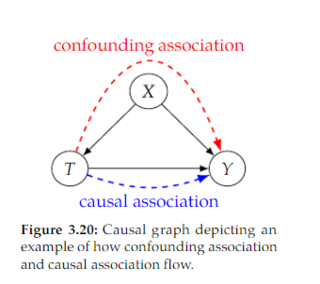
Open itWe refer to the flow of association along directed paths as causal association
Original toplevel document (pdf)
cannot see any pdfsFlashcard 7101888466188
| status | not learned | measured difficulty | 37% [default] | last interval [days] | |||
|---|---|---|---|---|---|---|---|
| repetition number in this series | 0 | memorised on | scheduled repetition | ||||
| scheduled repetition interval | last repetition or drill |
Parent (intermediate) annotation
Open itDefinition 3.4 (d-separation) Two (sets of) nodes 𝑋 and 𝑌 are d-separated by a set of nodes 𝑍 if all of the paths between (any node in) 𝑋 and (any node in) 𝑌 are blocked by 𝑍 Source: Pearl (1988), Probabilistic Reasoning in Intelligent Systems: Networks of Plausible Inference
Original toplevel document (pdf)
cannot see any pdfsFlashcard 7101892136204
| status | not learned | measured difficulty | 37% [default] | last interval [days] | |||
|---|---|---|---|---|---|---|---|
| repetition number in this series | 0 | memorised on | scheduled repetition | ||||
| scheduled repetition interval | last repetition or drill |
Parent (intermediate) annotation
Open itRegular Bayesian networks are purely statistical models, so we can only talk about the flow of association in Bayesian networks.
Original toplevel document (pdf)
cannot see any pdfsFlashcard 7101894757644
| status | not learned | measured difficulty | 37% [default] | last interval [days] | |||
|---|---|---|---|---|---|---|---|
| repetition number in this series | 0 | memorised on | scheduled repetition | ||||
| scheduled repetition interval | last repetition or drill |
Parent (intermediate) annotation
Open itPositivity is the condition that all subgroups of the data with different covariates have some probability of receiving any value of treatment
Original toplevel document (pdf)
cannot see any pdfs| status | not read | reprioritisations | ||
|---|---|---|---|---|
| last reprioritisation on | suggested re-reading day | |||
| started reading on | finished reading on |
SuperMemo: Subset learning
ty, difficulty, interval, recency, text size, etc. The review may also be semantic or neural where connections between elements determine the sequence of review. Review types Search and review S<span>earch and review in SuperMemo is a review of a subset of elements that contain a given search phrase. For example, before an exam in microbiology, a student may wish to review all his knowledge of viruses using the following method: search for all elements containing the phrase virus (e.g. with Ctrl+F) review all those elements (e.g. with Ctrl+Shift+L) The review may include all subset elements (e.g. Learning : Rev

