Do you want BuboFlash to help you learning these things? Or do you want to add or correct something? Click here to log in or create user.
Te demand curve
#cfa #cfa-level-1 #economics #has-images #microeconomics #reading-13-demand-and-supply-analysis-introduction
The demand function represents buyers' behavior.
Prices influence consumers' purchase decisions. The demand function can be depicted as a negatively sloped demand curve.
- If all other factors are equal, as the price of a good rises, consumer demand falls. This is mainly due to the availability of substitutes, which are goods that perform similar functions.
- As the price of a good falls, consumer demand rises.
Therefore, there is an inverse relationship between the price of a good and the amount that consumers are willing to buy. The demand curve normally slopes downward. It tells the analyst the quantity that consumers are willing to buy for each possible price when all other influences on consumers' planned purchases remain the same.
Example 1
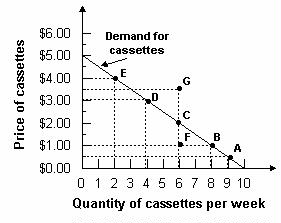
Refer to the graph below. What is the quantity of cassettes demanded when their price is $4.00 per week?
Answer: Two cassettes per week. The demand curve tells how much is demanded at each price. To determine the quantity demanded, find $4.00 on the vertical axis and read across until you meet the demand curve. Then read the quantity from the horizontal axis.
If you want to change selection, open document below and click on "Move attachment"
Subject 2. Basic Principles and Concepts
The Demand Function and the Demand Curve The demand function represents buyers' behavior. Prices influence consumers' purchase decisions. The demand function can be depicted as a negatively sloped demand curve. If all other factors are equal, as the price of a good rises, consumer demand falls. This is mainly due to the availability of substitutes, which are goods that perform similar functions. As the price of a good falls, consumer demand rises. Therefore, there is an inverse relationship between the price of a good and the amount that consumers are willing to buy. The demand curve normally slopes downward. It tells the analyst the quantity that consumers are willing to buy for each possible price when all other influences on consumers' planned purchases remain the same. Example 1 Refer to the graph below. What is the quantity of cassettes demanded when their price is $4.00 per week? Answer: Two cassettes per week. The demand curve tells how much is demanded at each price. To determine the quantity demanded, find $4.00 on the vertical axis and read across until you meet the demand curve. Then read the quantity from the horizontal axis. When any factor that influences buying plans, other than the price of the good, changes, there is a change in demand for that good. When the quantity of the good tha
Summary
| status | not read | reprioritisations | ||
|---|---|---|---|---|
| last reprioritisation on | suggested re-reading day | |||
| started reading on | finished reading on |
Details
Discussion
Do you want to join discussion? Click here to log in or create user.