Do you want BuboFlash to help you learning these things? Or do you want to add or correct something? Click here to log in or create user.
A Change in the Quantity Supplied Versus a Change in Supply
#cfa #cfa-level-1 #economics #has-images #microeconomics #reading-13-demand-and-supply-analysis-introduction #subject-2-basic-principles-and-concepts
The quantity supplied of a good or service is the amount that producers plan to sell during a given time period at a particular price.
Price is just one of the factors that affect producers' supply decisions. The supply curve isolates the impact of price on the quantity of a product supplied and assumes that all other factors stay the same.
- A change in quantity supplied is caused by a price change ONLY. It is a movement along the same supply curve.
- When one of the other factors that influence selling plans changes, there is a change in supply and a shift of the supply curve.
Example 6
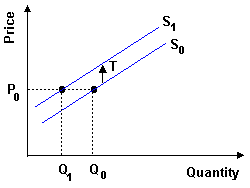
A tax will shift the supply curve up by the amount of the tax.

At every price level, less is supplied. For example, at price P0, originally Q0 is supplied. After the tax, Q1 is supplied at price P0.
If you want to change selection, open document below and click on "Move attachment"
Subject 2. Basic Principles and Concepts
in the cost of producing the good causes supply to shift leftward. An increase in the number of firms and a decrease in taxes cause supply to shift rightward. A change in price causes a movement along supply, not a shift. <span>A Change in the Quantity Supplied Versus a Change in Supply The quantity supplied of a good or service is the amount that producers plan to sell during a given time period at a particular price. Price is just one of the factors that affect producers' supply decisions. The supply curve isolates the impact of price on the quantity of a product supplied and assumes that all other factors stay the same. A change in quantity supplied is caused by a price change ONLY. It is a movement along the same supply curve. When one of the other factors that influence selling plans changes, there is a change in supply and a shift of the supply curve. Example 6 A tax will shift the supply curve up by the amount of the tax. At every price level, less is supplied. For example, at price P 0 , originally Q 0 is supplied. After the tax, Q 1 is supplied at price P 0 .<span><body><html>
Summary
| status | not read | reprioritisations | ||
|---|---|---|---|---|
| last reprioritisation on | suggested re-reading day | |||
| started reading on | finished reading on |
Details
Discussion
Do you want to join discussion? Click here to log in or create user.