Do you want BuboFlash to help you learning these things? Or do you want to add or correct something? Click here to log in or create user.
Aggregate Demand and Aggregate Supply
#cfa #cfa-level-1 #economics #has-images #microeconomics #reading-13-demand-and-supply-analysis-introduction #subject-3-market-equilibrium
An aggregate demand curve is simply a schedule that shows amounts of a product that buyers collectively desire to purchase at each possible price level.
An aggregate supply curve is simply a curve showing the amounts of a product that all firms will produce at each price level.
Example 1
Refer to the graph below. What is the market quantity that would be supplied at a price of $2.00?
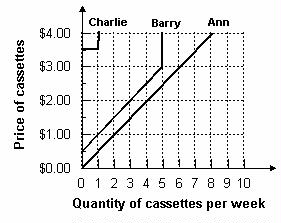
Market quantity is the sum of individual quantities supplied at each price. At a price of $2.00, Ann supplies 4, Barry supplies 3, and Charlie supplies 0. The market supply is 7.
If you want to change selection, open document below and click on "Move attachment"
Subject 3. Market Equilibrium
Aggregate Demand and Aggregate Supply An aggregate demand curve is simply a schedule that shows amounts of a product that buyers collectively desire to purchase at each possible price level. An aggregate supply curve is simply a curve showing the amounts of a product that all firms will produce at each price level. Example 1 Refer to the graph below. What is the market quantity that would be supplied at a price of $2.00? Market quantity is the sum of individual quantities supplied at each price. At a price of $2.00, Ann supplies 4, Barry supplies 3, and Charlie supplies 0. The market supply is 7. Market Equilibrium Equilibrium is a state in which conflicting forces are in balance. In equilibrium, it will be possible for both buyers and sel
Summary
| status | not read | reprioritisations | ||
|---|---|---|---|---|
| last reprioritisation on | suggested re-reading day | |||
| started reading on | finished reading on |
Details
Discussion
Do you want to join discussion? Click here to log in or create user.