Do you want BuboFlash to help you learning these things? Or do you want to add or correct something? Click here to log in or create user.
#cfa #cfa-level-1 #economics #has-images #microeconomics #reading-14-demand-and-supply-analysis-consumer-demand
Indifference curve analysis lies behind a demand curve. It can be used to examine the effect of price changes and income changes.

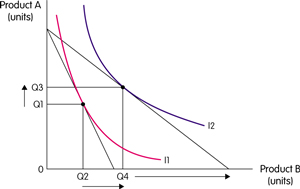
If the price of B now falls, the budget line will pivot. The consumer now maximises utility consuming Q3 of product A and Q4 of product B. The fall in the price of product B has led to an increase in the quantity demanded of Q2Q4. This can be shown on a demand curve.

If you want to change selection, open document below and click on "Move attachment"
Subject 5. Revisiting the Consumer's Demand Function
Indifference curve analysis lies behind a demand curve. It can be used to examine the effect of price changes and income changes. If the price of B now falls, the budget line will pivot. The consumer now maximises utility consuming Q3 of product A and Q4 of product B. The fall in the price of product B has led to an increase in the quantity demanded of Q2Q4. This can be shown on a demand curve. There are two different phenomena underlying a consumer's response to a price drop: As the price of a product d
Summary
| status | not read | reprioritisations | ||
|---|---|---|---|---|
| last reprioritisation on | suggested re-reading day | |||
| started reading on | finished reading on |
Details
Discussion
Do you want to join discussion? Click here to log in or create user.