Do you want BuboFlash to help you learning these things? Or do you want to add or correct something? Click here to log in or create user.
#cfa #cfa-level-1 #economics #has-images #microeconomics #reading-13-demand-and-supply-analysis-introduction
The Supply Function and the Supply Curve
The supply function represents sellers' behavior.
Positively sloped supply curve (upward).
The supply curve, tells the analyst the quantity that producers are willing to supply for each price when all other influences on producers' planned sales remain the same.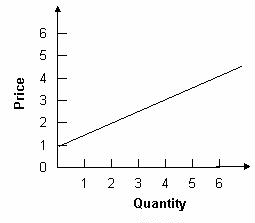
- Resources and technology determine what it is possible to produce.
- Supply reflects what is best to produce (amongst what is technologically possible).
The supply function represents sellers' behavior.
Prices influence producers' supply decisions.
Positively sloped supply curve (upward).
- Higher price, higher incentive to supply the good. (if ceteris paribus)
- Higher prices higher profit.
- As the price of a good falls, its supply falls as well.
There is a direct relationship between the price of a good and the amount of that good that will be supplied.
The supply curve, tells the analyst the quantity that producers are willing to supply for each price when all other influences on producers' planned sales remain the same.
Example 4
The graph below displays the quantity associated with price in a supply table.
0 is the quantity that will be associated with a price of $1 on a supply table.
The law of supply results from the general tendency for the marginal cost of producing a good or service to increase as the quantity produced increases.
A supply curve is also a minimum-supply-price curve. The greater the quantity produced, the higher the price a firm must be offered to be willing to produce that quantity.
If you want to change selection, open original toplevel document below and click on "Move attachment"
The Supply Function and the Supply Curve Resources and technology determine what it is possible to produce. Supply reflects a decision about which technologically feasible items are best to produce. The supply function represents sellers' behavior. Prices influence producers' supply decisions. The supply function can be depicted as a positively sloped supply curve. If all other factors are equal, a higher price will increase the producer's incentive to supply the good. Higher prices increase the producer's profit, which is the excess of sales revenue over the cost of production. As the price of a good falls, its supply falls as well. Therefore, there is a direct relationship between the price of a good and the amount of that good that will be supplied. The supply curve slopes upward. It tells the analyst the quantity that producers are willing to supply for each price when all other influences on producers' planned sales remain the same. Example 4 The graph below displays the quantity associated with price in a supply table. To find the quantity supplied at a price of $1, extend a horizontal line from $1 to the supply curve and drop a vertical line down to the quantity axis. These lines will intersect at 0. This is the quantity that will be associated with a price of $1 on a supply table. The law of supply results from the general tendency for the marginal cost of producing a good or service to increase as the quantity produced increases. A supply curve is also a minimum-supply-price curve. The greater the quantity produced, the higher the price a firm must be offered to be willing to produce that quantity.
Which arrow best represents this statement? Answer: C. A change in price causes a movement along the demand curve. When price falls, the movement is downward and to the right. <span>The Supply Function and the Supply Curve Resources and technology determine what it is possible to produce. Supply reflects a decision about which technologically feasible items are best to produce. The supply function represents sellers' behavior. Prices influence producers' supply decisions. The supply function can be depicted as a positively sloped supply curve. If all other factors are equal, a higher price will increase the producer's incentive to supply the good. Higher prices increase the producer's profit, which is the excess of sales revenue over the cost of production. As the price of a good falls, its supply falls as well. Therefore, there is a direct relationship between the price of a good and the amount of that good that will be supplied. The supply curve slopes upward. It tells the analyst the quantity that producers are willing to supply for each price when all other influences on producers' planned sales remain the same. Example 4 The graph below displays the quantity associated with price in a supply table. To find the quantity supplied at a price of $1, extend a horizontal line from $1 to the supply curve and drop a vertical line down to the quantity axis. These lines will intersect at 0. This is the quantity that will be associated with a price of $1 on a supply table. The law of supply results from the general tendency for the marginal cost of producing a good or service to increase as the quantity produced increases. A supply curve is also a minimum-supply-price curve. The greater the quantity produced, the higher the price a firm must be offered to be willing to produce that quantity. A Change in Supply Changes in other factors will influence the amount of products that producers are willing to supply. These factors include the
Parent (intermediate) annotation
Open itThe Supply Function and the Supply Curve Resources and technology determine what it is possible to produce. Supply reflects a decision about which technologically feasible items are best to produce. The supply function represents sellers' behavior. Prices influence producers' supply decisions. The supply function can be depicted as a positively sloped supply curve. If all other factors are equal, a higher price will increase the producer's incentive to supply the good. Higher prices increase the producer's profit, which is the excess of sales revenue over the cost of production. As the price of a good falls, its supply falls as well. Therefore, there is a direct relationship between the price of a good and the amount of that good that will be supplied. The supply curve slopes upward. It tells the analyst the quantity that producers are willing to supply for each price when all other influences on producers' planned sales remain the same. Example 4 The graph below displays the quantity associated with price in a supply table. To find the quantity supplied at a price of $1, extend a horizontal line from $1 to the supply curve and drop a vertical line down to the quantity axis. These lines will intersect at 0. This is the quantity that will be associated with a price of $1 on a supply table. The law of supply results from the general tendency for the marginal cost of producing a good or service to increase as the quantity produced increases. A supply curve is also a minimum-supply-price curve. The greater the quantity produced, the higher the price a firm must be offered to be willing to produce that quantity.
Original toplevel document
Subject 2. Basic Principles and ConceptsWhich arrow best represents this statement? Answer: C. A change in price causes a movement along the demand curve. When price falls, the movement is downward and to the right. <span>The Supply Function and the Supply Curve Resources and technology determine what it is possible to produce. Supply reflects a decision about which technologically feasible items are best to produce. The supply function represents sellers' behavior. Prices influence producers' supply decisions. The supply function can be depicted as a positively sloped supply curve. If all other factors are equal, a higher price will increase the producer's incentive to supply the good. Higher prices increase the producer's profit, which is the excess of sales revenue over the cost of production. As the price of a good falls, its supply falls as well. Therefore, there is a direct relationship between the price of a good and the amount of that good that will be supplied. The supply curve slopes upward. It tells the analyst the quantity that producers are willing to supply for each price when all other influences on producers' planned sales remain the same. Example 4 The graph below displays the quantity associated with price in a supply table. To find the quantity supplied at a price of $1, extend a horizontal line from $1 to the supply curve and drop a vertical line down to the quantity axis. These lines will intersect at 0. This is the quantity that will be associated with a price of $1 on a supply table. The law of supply results from the general tendency for the marginal cost of producing a good or service to increase as the quantity produced increases. A supply curve is also a minimum-supply-price curve. The greater the quantity produced, the higher the price a firm must be offered to be willing to produce that quantity. A Change in Supply Changes in other factors will influence the amount of products that producers are willing to supply. These factors include the
Summary
| status | not read | reprioritisations | ||
|---|---|---|---|---|
| last reprioritisation on | suggested re-reading day | |||
| started reading on | finished reading on |
Details
Discussion
Do you want to join discussion? Click here to log in or create user.