Do you want BuboFlash to help you learning these things? Or do you want to add or correct something? Click here to log in or create user.
Tags
#cfa #cfa-level-1 #economics #has-images #reading-15-demand-and-supply-analysis-the-firm #section-3-analysis-of-revenue-costs-and-profit
Question
This shows the breakeven point under perfect competition using the [...] approach.
Answer
total revenue–total cost
Tags
#cfa #cfa-level-1 #economics #has-images #reading-15-demand-and-supply-analysis-the-firm #section-3-analysis-of-revenue-costs-and-profit
Question
This shows the breakeven point under perfect competition using the [...] approach.
Answer
?
Tags
#cfa #cfa-level-1 #economics #has-images #reading-15-demand-and-supply-analysis-the-firm #section-3-analysis-of-revenue-costs-and-profit
Question
This shows the breakeven point under perfect competition using the [...] approach.
Answer
total revenue–total cost
If you want to change selection, open original toplevel document below and click on "Move attachment"
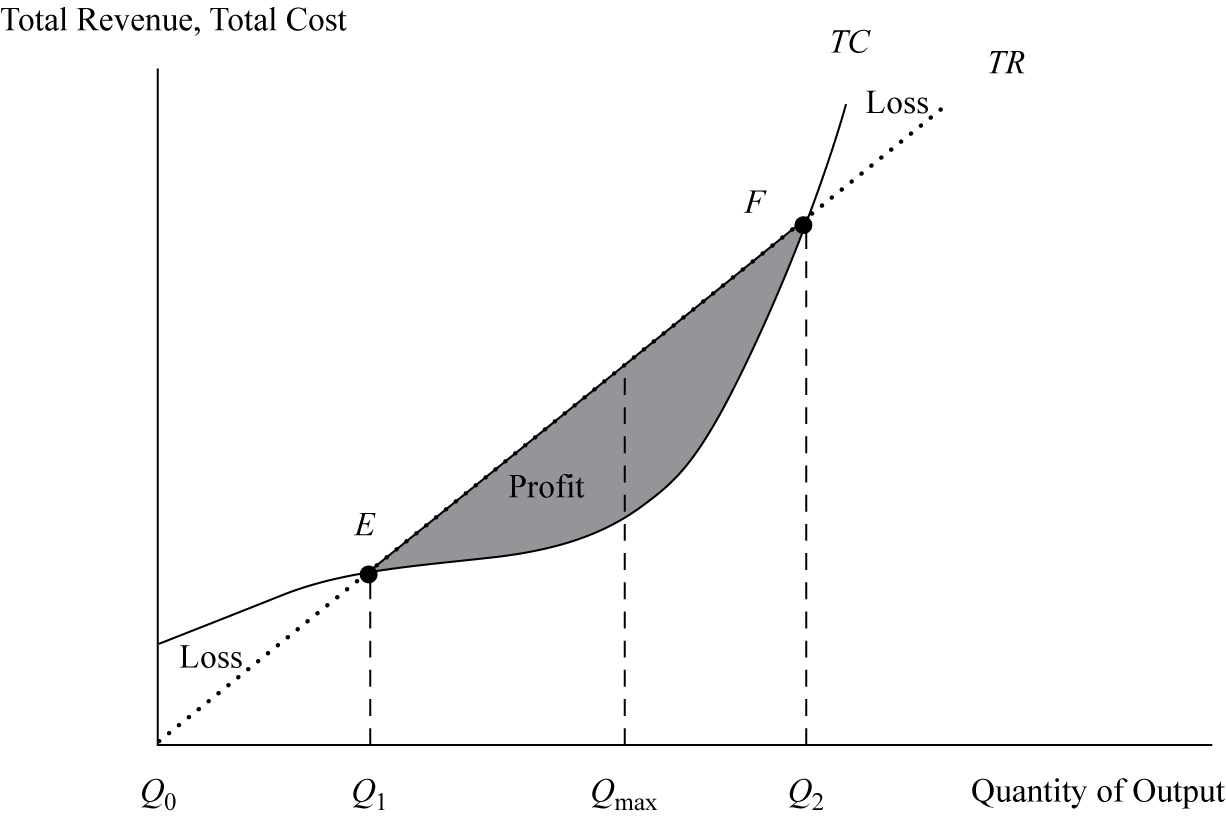
This shows the breakeven point under perfect competition using the total revenue–total cost approach.
Exhibit 18 shows the breakeven point under perfect competition using the total revenue–total cost approach. Actually, there are two breakeven points—lower (point E) and upper (point F). Below point E, the firm is losing money (economic losses), and beyond that point is the region of profitabi
Parent (intermediate) annotation
Open itThis shows the breakeven point under perfect competition using the total revenue–total cost approach.
Original toplevel document
Open itExhibit 18 shows the breakeven point under perfect competition using the total revenue–total cost approach. Actually, there are two breakeven points—lower (point E) and upper (point F). Below point E, the firm is losing money (economic losses), and beyond that point is the region of profitabi
Summary
| status | not learned | measured difficulty | 37% [default] | last interval [days] | |||
|---|---|---|---|---|---|---|---|
| repetition number in this series | 0 | memorised on | scheduled repetition | ||||
| scheduled repetition interval | last repetition or drill |
Details
No repetitionsDiscussion
Do you want to join discussion? Click here to log in or create user.