Do you want BuboFlash to help you learning these things? Or do you want to add or correct something? Click here to log in or create user.
#cfa #cfa-level-1 #economics #has-images #reading-15-demand-and-supply-analysis-the-firm #section-3-analysis-of-revenue-costs-and-profit
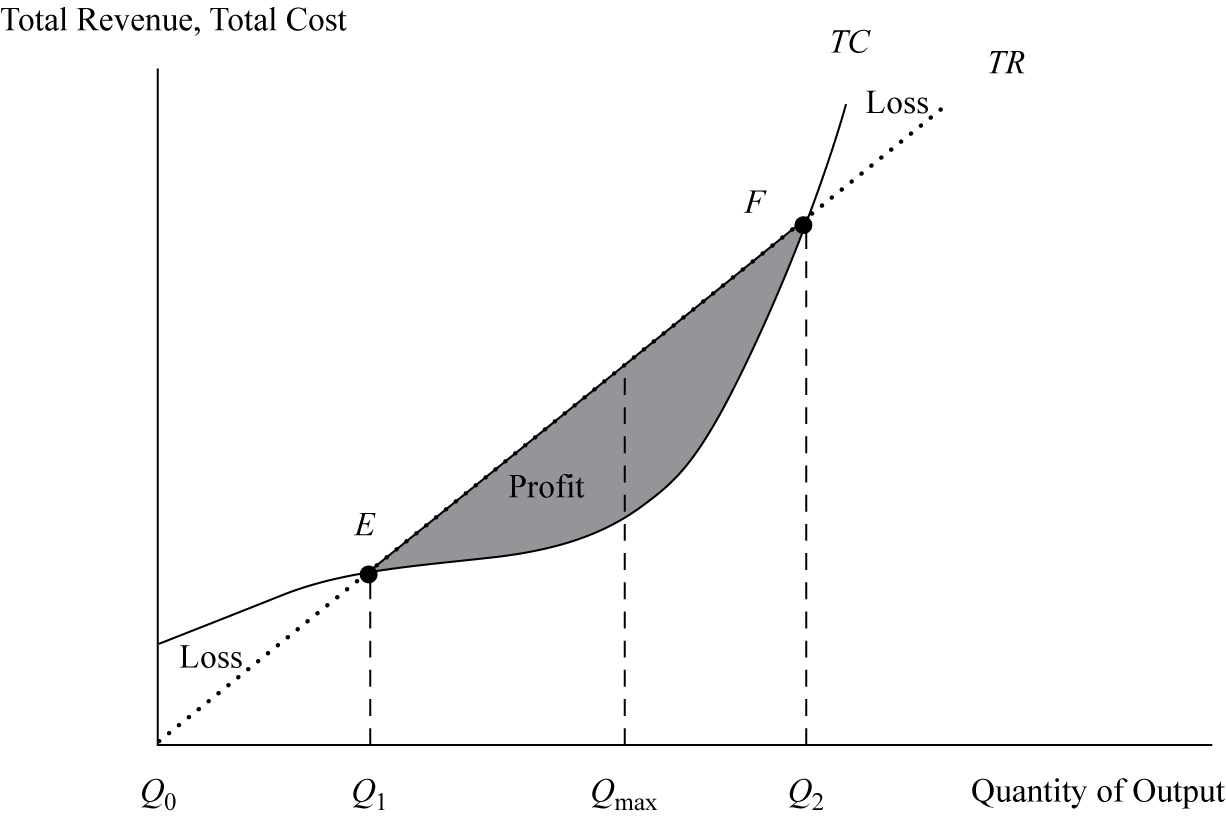
Within this profit area, a specific quantity (Qmax) maximizes profit as the largest difference between TR and TC
If you want to change selection, open document below and click on "Move attachment"
Open it
ally, there are two breakeven points—lower (point E) and upper (point F). Below point E, the firm is losing money (economic losses), and beyond that point is the region of profitability (shaded area) that extends to the upper breakeven point. <span>Within this profit area, a specific quantity (Q max ) maximizes profit as the largest difference between TR and TC. Point F is where the firm leaves the profit region and incurs economic losses again. This second region of economic losses develops when the firm’s production begins to reach the limit
Summary
| status | not read | reprioritisations | ||
|---|---|---|---|---|
| last reprioritisation on | suggested re-reading day | |||
| started reading on | finished reading on |
Details
Discussion
Do you want to join discussion? Click here to log in or create user.