Edited, memorised or added to reading queue

on 21-Apr-2022 (Thu)

Do you want BuboFlash to help you learning these things? Click here to log in or create user.


#causality #statistics
#causality #has-images #statistics
Blocked path definition
statusnot read reprioritisations
last reprioritisation on suggested re-reading day
started reading on finished reading on

pdf

cannot see any pdfs


#causality #statistics

Definition 3.3 (blocked path) A path between nodes 𝑋 and π‘Œ is blocked by a (potentially empty) conditioning set 𝑍 if either of the following is true:

1. Along the path, there is a chain Β· Β· Β· β†’ π‘Š β†’ Β· Β· Β· or a fork Β· Β· Β· ← π‘Š β†’ Β· Β· Β·, where π‘Š is conditioned on (π‘Š ∈ 𝑍).

2. There is a collider π‘Š on the path that is not conditioned on ( π‘Š βˆ‰ 𝑍 ) and none of its descendants are conditioned on (de(π‘Š) * 𝑍)

statusnot read reprioritisations
last reprioritisation on suggested re-reading day
started reading on finished reading on

pdf

cannot see any pdfs


#causality #statistics

Definition 3.4 (d-separation) Two (sets of) nodes 𝑋 and π‘Œ are d-separated by a set of nodes 𝑍 if all of the paths between (any node in) 𝑋 and (any node in) π‘Œ are blocked by 𝑍

Source: Pearl (1988), Probabilistic Reasoning in Intelligent Systems: Networks of Plausible Inference

statusnot read reprioritisations
last reprioritisation on suggested re-reading day
started reading on finished reading on

pdf

cannot see any pdfs


#causality #statistics
If all the paths between two nodes 𝑋 and π‘Œ are blocked, then we say that 𝑋 and π‘Œ are d-separated.
statusnot read reprioritisations
last reprioritisation on suggested re-reading day
started reading on finished reading on

pdf

cannot see any pdfs


#causality #statistics
if there exists at least one path between 𝑋 and π‘Œ that is unblocked, then we say that 𝑋 and π‘Œ are d-connected.
statusnot read reprioritisations
last reprioritisation on suggested re-reading day
started reading on finished reading on

pdf

cannot see any pdfs


#causality #has-images #statistics
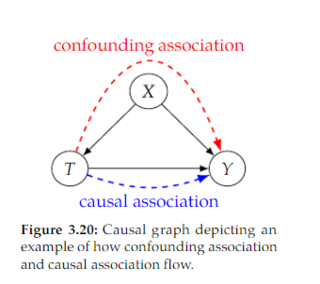
We refer to the flow of association along directed paths as causal association. A common type of non-causal association that makes total association not causation is confounding association. In the graph in Figure 3.20, we depict the confounding association in red and the causal association in blue
statusnot read reprioritisations
last reprioritisation on suggested re-reading day
started reading on finished reading on

pdf

cannot see any pdfs


#causality #statistics
Association flows along all unblocked paths. In causal graphs, causation flows along directed paths. Recall from Section 1.3.2 that not only is association not causation, but causation is a sub-category of association. That’s why association and causation both flow along directed paths.
statusnot read reprioritisations
last reprioritisation on suggested re-reading day
started reading on finished reading on

pdf

cannot see any pdfs


#causality #statistics
Regular Bayesian networks are purely statistical models, so we can only talk about the flow of association in Bayesian networks. Association still flows in exactly the same way in Bayesian networks as it does in causal graphs, though. In both, association flows along chains and forks, unless a node is conditioned on. And in both, a collider blocks the flow of association, unless it is conditioned on. Combining these building blocks, we get how association flows in general DAGs. We can tell if two nodes are not associated (no association flows between them) by whether or not they are d-separated.
statusnot read reprioritisations
last reprioritisation on suggested re-reading day
started reading on finished reading on

pdf

cannot see any pdfs


#causality #statistics
Causal graphs are special in that we additionally assume that the edges have causal meaning (causal edges assumption, Assumption 3.3). This assumption is what introduces causality into our models, and it makes one type of path take on a whole new meaning: directed paths. This assumption endows directed paths with the unique role of carrying causation along them. Additionally, this assumption is asymmetric; β€œ 𝑋 is a cause of π‘Œ ” is not the same as saying β€œ π‘Œ is a cause of 𝑋 .” This means that there is an important difference between association and causation: association is symmetric, whereas causation is asymmetric
statusnot read reprioritisations
last reprioritisation on suggested re-reading day
started reading on finished reading on

pdf

cannot see any pdfs


#causality #statistics

d-separation Implies Association is Causation

Given that we have tools to measure association, how can we isolate causation? In other words, how can we ensure that the association we measure is causation, say, for measuring the causal effect of 𝑋 on π‘Œ ? Well, we can do that by ensuring that there is no non-causal association flowing between 𝑋 and π‘Œ . This is true if 𝑋 and π‘Œ are d-separated in the augmented graph where we remove outgoing edges from 𝑋 . This is because all of 𝑋 ’s causal effect on π‘Œ would flow through it’s outgoing edges, so once those are removed, the only association that remains is purely non-causal association

statusnot read reprioritisations
last reprioritisation on suggested re-reading day
started reading on finished reading on

pdf

cannot see any pdfs


#causality #statistics
#causality #has-images #statistics
statusnot read reprioritisations
last reprioritisation on suggested re-reading day
started reading on finished reading on

pdf

cannot see any pdfs


#causality #statistics
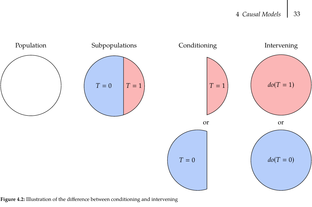
Whenever, do(𝑑) appears after the conditioning bar, it means that everything in that expression is in the post-intervention world where the intervention do(𝑑) occurs. For example, 𝔼[π‘Œ | do(𝑑), 𝑍 = 𝑧] refers to the expected outcome in the subpopulation where 𝑍 = 𝑧 after the whole subpopulation has taken treatment 𝑑 . In contrast, 𝔼[π‘Œ | 𝑍 = 𝑧] simply refers to the expected value in the (pre-intervention) population where individuals take whatever treatment they would normally take ( 𝑇 ). This distinction will become important when we get to counterfactuals in
statusnot read reprioritisations
last reprioritisation on suggested re-reading day
started reading on finished reading on

pdf

cannot see any pdfs


#causality #statistics
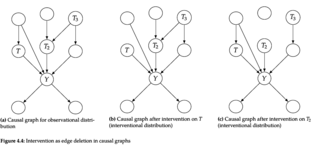
The causal graph for interventional distributions is simply the same graph that was used for the observational joint distribution, but with all of the edges to the intervened node(s) removed. This is because the probability for the intervened factor has been set to 1, so we can just ignore that factor (this is the focus of the next section). Another way to see that the intervened node has no causal parents is that the intervened node is set to a constant value, so it no longer depends on any of the variables it depends on in the observational setting (its parents). The graph with edges removed is known as the manipulated graph
statusnot read reprioritisations
last reprioritisation on suggested re-reading day
started reading on finished reading on

pdf

cannot see any pdfs


#causality #statistics
#causality #has-images #statistics
statusnot read reprioritisations
last reprioritisation on suggested re-reading day
started reading on finished reading on

pdf

cannot see any pdfs


#causality #has-images #statistics

We assumed 𝑋 is discrete when we summed over its values, but we can simply replace the sum with an integral if 𝑋 is continuous. Throughout this book, that will be the case, so we usually won’t point it out

To jest kluczowe rΓ³wnanie.

statusnot read reprioritisations
last reprioritisation on suggested re-reading day
started reading on finished reading on

pdf

cannot see any pdfs


#causality #statistics
As we discussed in Section 4.2, the graph for the interventional distribution 𝑃(π‘Œ | do(𝑑)) is the same as the graph for the observational distribution 𝑃(π‘Œ, 𝑇, 𝑋) , but with the incoming edges to 𝑇 removed. For example, if we take the graph from Figure 4.5 and intervene on 𝑇 , then we get the manipulated graph in Figure 4.6. In this manipulated graph, there cannot be any backdoor paths because no edges are going into the backdoor of 𝑇 . Therefore, all of the association that flows from 𝑇 to π‘Œ in the manipulated graph is purely causal.
statusnot read reprioritisations
last reprioritisation on suggested re-reading day
started reading on finished reading on

pdf

cannot see any pdfs