Do you want BuboFlash to help you learning these things? Or do you want to add or correct something? Click here to log in or create user.
Cambios en la curva de la demanda
#cfa #cfa-level-1 #economics #has-images #microeconomics #reading-13-demand-and-supply-analysis-introduction
Cuando un factor, que no sea el precio, influencia los planes de compra, existe un cambio en la demanda de ese bien.
Cuando la cantidad demandada cambia a cada uno de los presios, existe una nueva curva de la demanda.
Los factores que la cambian pueden ser ingresos, número de consumidores, cambio en el precio de productos relacionados, etc.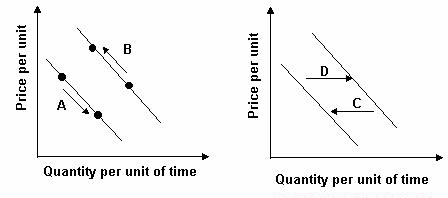
Cuando la cantidad demandada cambia a cada uno de los presios, existe una nueva curva de la demanda.
Los factores que la cambian pueden ser ingresos, número de consumidores, cambio en el precio de productos relacionados, etc.
Example 2
Assume the graph below reflects demand in the automobile market. Which arrow best captures the impact of increased consumer income on the automobile market?
Answer: D. Income is a shift factor of demand. An increase in income increases the number of automobiles demanded at each price. Therefore demand has shifted to the right.
- When demand increases, the quantity that people plan to buy increases at each and every price, so the demand curve shifts rightward.
- When demand decreases, the quantity that people plan to buy decreases at each and every price, so the demand curve shifts leftward.
If you want to change selection, open original toplevel document below and click on "Move attachment"
When any factor that influences buying plans, other than the price of the good, changes, there is a change in demand for that good. When the quantity of the good that people plan to buy changes at each and every price, there is a new demand curve. These factors include changes in income, number of consumers in the market, changes in the price of a related good, etc. Example 2 Assume the graph below reflects demand in the automobile market. Which arrow best captures the impact of increased consumer income on the automobile market? Answer: D. Income is a shift factor of demand. An increase in income increases the number of automobiles demanded at each price. Therefore demand has shifted to the right. When demand increases, the quantity that people plan to buy increases at each and every price, so the demand curve shifts rightward. When demand decreases, the quantity that people plan to buy decreases at each and every price, so the demand curve shifts leftward.
e demand curve tells how much is demanded at each price. To determine the quantity demanded, find $4.00 on the vertical axis and read across until you meet the demand curve. Then read the quantity from the horizontal axis. <span>When any factor that influences buying plans, other than the price of the good, changes, there is a change in demand for that good. When the quantity of the good that people plan to buy changes at each and every price, there is a new demand curve. These factors include changes in income, number of consumers in the market, changes in the price of a related good, etc. Example 2 Assume the graph below reflects demand in the automobile market. Which arrow best captures the impact of increased consumer income on the automobile market? Answer: D. Income is a shift factor of demand. An increase in income increases the number of automobiles demanded at each price. Therefore demand has shifted to the right. When demand increases, the quantity that people plan to buy increases at each and every price, so the demand curve shifts rightward. When demand decreases, the quantity that people plan to buy decreases at each and every price, so the demand curve shifts leftward. A Change in the Quantity Demanded Versus a Change in Demand The demand curve isolates the impact of price on the amount of a product purchased.&
Parent (intermediate) annotation
Open itWhen any factor that influences buying plans, other than the price of the good, changes, there is a change in demand for that good. When the quantity of the good that people plan to buy changes at each and every price, there is a new demand curve. These factors include changes in income, number of consumers in the market, changes in the price of a related good, etc. Example 2 Assume the graph below reflects demand in the automobile market. Which arrow best captures the impact of increased consumer income on the automobile market? Answer: D. Income is a shift factor of demand. An increase in income increases the number of automobiles demanded at each price. Therefore demand has shifted to the right. When demand increases, the quantity that people plan to buy increases at each and every price, so the demand curve shifts rightward. When demand decreases, the quantity that people plan to buy decreases at each and every price, so the demand curve shifts leftward.
Original toplevel document
Subject 2. Basic Principles and Conceptse demand curve tells how much is demanded at each price. To determine the quantity demanded, find $4.00 on the vertical axis and read across until you meet the demand curve. Then read the quantity from the horizontal axis. <span>When any factor that influences buying plans, other than the price of the good, changes, there is a change in demand for that good. When the quantity of the good that people plan to buy changes at each and every price, there is a new demand curve. These factors include changes in income, number of consumers in the market, changes in the price of a related good, etc. Example 2 Assume the graph below reflects demand in the automobile market. Which arrow best captures the impact of increased consumer income on the automobile market? Answer: D. Income is a shift factor of demand. An increase in income increases the number of automobiles demanded at each price. Therefore demand has shifted to the right. When demand increases, the quantity that people plan to buy increases at each and every price, so the demand curve shifts rightward. When demand decreases, the quantity that people plan to buy decreases at each and every price, so the demand curve shifts leftward. A Change in the Quantity Demanded Versus a Change in Demand The demand curve isolates the impact of price on the amount of a product purchased.&
Summary
| status | not read | reprioritisations | ||
|---|---|---|---|---|
| last reprioritisation on | suggested re-reading day | |||
| started reading on | finished reading on |
Details
Discussion
Do you want to join discussion? Click here to log in or create user.