Edited, memorised or added to reading queue
on 16-Nov-2016 (Wed)
Do you want BuboFlash to help you learning these things? Click here to log in or create user.
Flashcard 1420047813900
| status | not learned | measured difficulty | 37% [default] | last interval [days] | |||
|---|---|---|---|---|---|---|---|
| repetition number in this series | 0 | memorised on | scheduled repetition | ||||
| scheduled repetition interval | last repetition or drill |
Flashcard 1420049648908

| status | not learned | measured difficulty | 37% [default] | last interval [days] | |||
|---|---|---|---|---|---|---|---|
| repetition number in this series | 0 | memorised on | scheduled repetition | ||||
| scheduled repetition interval | last repetition or drill |
Flashcard 1420051483916
| status | not learned | measured difficulty | 37% [default] | last interval [days] | |||
|---|---|---|---|---|---|---|---|
| repetition number in this series | 0 | memorised on | scheduled repetition | ||||
| scheduled repetition interval | last repetition or drill |

| status | not read | reprioritisations | ||
|---|---|---|---|---|
| last reprioritisation on | suggested re-reading day | |||
| started reading on | finished reading on |
Parent (intermediate) annotation
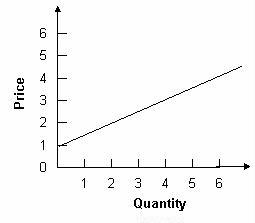
Open itThe Supply Function and the Supply Curve Resources and technology determine what it is possible to produce. Supply reflects a decision about which technologically feasible items are best to produce. The supply function represents sellers' behavior. Prices influence producers' supply decisions. The supply function can be depicted as a positively sloped supply curve. If all other factors are equal, a higher price will increase the producer's incentive to supply the good. Higher prices increase the producer's profit, which is the excess of sales revenue over the cost of production. As the price of a good falls, its supply falls as well. Therefore, there is a direct relationship between the price of a good and the amount of that good that will be supplied. The supply curve slopes upward. It tells the analyst the quantity that producers are willing to supply for each price when all other influences on producers' planned sales remain the same. Example 4 The graph below displays the quantity associated with price in a supply table. To find the quantity supplied at a price of $1, extend a horizontal line from $1 to the supply curve and drop a vertical line down to the quantity axis. These lines will intersect at 0. This is the quantity that will be associated with a price of $1 on a supply table. The law of supply results from the general tendency for the marginal cost of producing a good or service to increase as the quantity produced increases. A supply curve is also a minimum-supply-price curve. The greater the quantity produced, the higher the price a firm must be offered to be willing to produce that quantity.
Original toplevel document
Subject 2. Basic Principles and ConceptsWhich arrow best represents this statement? Answer: C. A change in price causes a movement along the demand curve. When price falls, the movement is downward and to the right. <span>The Supply Function and the Supply Curve Resources and technology determine what it is possible to produce. Supply reflects a decision about which technologically feasible items are best to produce. The supply function represents sellers' behavior. Prices influence producers' supply decisions. The supply function can be depicted as a positively sloped supply curve. If all other factors are equal, a higher price will increase the producer's incentive to supply the good. Higher prices increase the producer's profit, which is the excess of sales revenue over the cost of production. As the price of a good falls, its supply falls as well. Therefore, there is a direct relationship between the price of a good and the amount of that good that will be supplied. The supply curve slopes upward. It tells the analyst the quantity that producers are willing to supply for each price when all other influences on producers' planned sales remain the same. Example 4 The graph below displays the quantity associated with price in a supply table. To find the quantity supplied at a price of $1, extend a horizontal line from $1 to the supply curve and drop a vertical line down to the quantity axis. These lines will intersect at 0. This is the quantity that will be associated with a price of $1 on a supply table. The law of supply results from the general tendency for the marginal cost of producing a good or service to increase as the quantity produced increases. A supply curve is also a minimum-supply-price curve. The greater the quantity produced, the higher the price a firm must be offered to be willing to produce that quantity. A Change in Supply Changes in other factors will influence the amount of products that producers are willing to supply. These factors include the
| status | not read | reprioritisations | ||
|---|---|---|---|---|
| last reprioritisation on | suggested re-reading day | |||
| started reading on | finished reading on |
Parent (intermediate) annotation
Open itThe quantity supplied of a good or service is the amount that producers plan to sell during a given time period at a particular price. Price is just one of the factors that affect producers' supply decisions. The supply curve isolates the impact of price on the quantity of a product supplied and assumes that all other factors stay the same. A change in quantity supplied is caused by a price change ONLY. It is a movement along the same supply curve. When one of the other factors that influence selling plans changes, there is a change in supply and a shift of the supply curve. Example 6 A tax will shift the supply curve up by the amount of the tax. At every price level, less is supplied. For example, at price P 0 , originally Q 0 is supplied. After the tax, Q 1 is supplied at price P 0 .
Original toplevel document
Subject 2. Basic Principles and Conceptsin the cost of producing the good causes supply to shift leftward. An increase in the number of firms and a decrease in taxes cause supply to shift rightward. A change in price causes a movement along supply, not a shift. <span>A Change in the Quantity Supplied Versus a Change in Supply The quantity supplied of a good or service is the amount that producers plan to sell during a given time period at a particular price. Price is just one of the factors that affect producers' supply decisions. The supply curve isolates the impact of price on the quantity of a product supplied and assumes that all other factors stay the same. A change in quantity supplied is caused by a price change ONLY. It is a movement along the same supply curve. When one of the other factors that influence selling plans changes, there is a change in supply and a shift of the supply curve. Example 6 A tax will shift the supply curve up by the amount of the tax. At every price level, less is supplied. For example, at price P 0 , originally Q 0 is supplied. After the tax, Q 1 is supplied at price P 0 .<span><body><html>
| status | not read | reprioritisations | ||
|---|---|---|---|---|
| last reprioritisation on | suggested re-reading day | |||
| started reading on | finished reading on |
| status | not read | reprioritisations | ||
|---|---|---|---|---|
| last reprioritisation on | suggested re-reading day | |||
| started reading on | finished reading on |
| status | not read | reprioritisations | ||
|---|---|---|---|---|
| last reprioritisation on | suggested re-reading day | |||
| started reading on | finished reading on |
| status | not read | reprioritisations | ||
|---|---|---|---|---|
| last reprioritisation on | suggested re-reading day | |||
| started reading on | finished reading on |
| status | not read | reprioritisations | ||
|---|---|---|---|---|
| last reprioritisation on | suggested re-reading day | |||
| started reading on | finished reading on |
| status | not read | reprioritisations | ||
|---|---|---|---|---|
| last reprioritisation on | suggested re-reading day | |||
| started reading on | finished reading on |