Edited, memorised or added to reading queue
on 31-Jul-2017 (Mon)
Do you want BuboFlash to help you learning these things? Click here to log in or create user.
Flashcard 1428483083532
| status | not learned | measured difficulty | 37% [default] | last interval [days] | |||
|---|---|---|---|---|---|---|---|
| repetition number in this series | 0 | memorised on | scheduled repetition | ||||
| scheduled repetition interval | last repetition or drill |
Parent (intermediate) annotation
Open itEl concepto de la cantidad en Algebra es m ucho más amplio que en A ritm ética.
Original toplevel document (pdf)
cannot see any pdfsFlashcard 1432472390924
| status | not learned | measured difficulty | 37% [default] | last interval [days] | |||
|---|---|---|---|---|---|---|---|
| repetition number in this series | 0 | memorised on | scheduled repetition | ||||
| scheduled repetition interval | last repetition or drill |
Parent (intermediate) annotation
Open itA word is a symbol. Its matter is the sensible sign; its form is the meaning imposed upon it by convention.
Original toplevel document (pdf)
cannot see any pdfsFlashcard 1439706516748
| status | not learned | measured difficulty | 37% [default] | last interval [days] | |||
|---|---|---|---|---|---|---|---|
| repetition number in this series | 0 | memorised on | scheduled repetition | ||||
| scheduled repetition interval | last repetition or drill |
Parent (intermediate) annotation
Open itot observable but, rather, must be estimated. Arriving at a cost of capital estimate requires a host of assumptions and estimates. Another challenge is that the cost of capital that is appropriately applied to a specific investment depends on <span>the characteristics of that investment: The riskier the investment’s cash flows, the greater its cost of capital. In reality, a company must estimate project-specific costs of capital. What is often done, however, is to estim
Original toplevel document
1. INTRODUCTIONital is a central issue in corporate financial management. For the analyst seeking to evaluate a company’s investment program and its competitive position, an accurate estimate of a company’s cost of capital is important as well. <span>Cost of capital estimation is a challenging task. As we have already implied, the cost of capital is not observable but, rather, must be estimated. Arriving at a cost of capital estimate requires a host of assumptions and estimates. Another challenge is that the cost of capital that is appropriately applied to a specific investment depends on the characteristics of that investment: The riskier the investment’s cash flows, the greater its cost of capital. In reality, a company must estimate project-specific costs of capital. What is often done, however, is to estimate the cost of capital for the company as a whole and then adjust this overall corporate cost of capital upward or downward to reflect the risk of the contemplated project relative to the company’s average project. This reading is organized as follows: In the next section, we introduce the cost of capital and its basic computation. Section 3 presents a selection of methods for estimat
Flashcard 1452123229452
| status | not learned | measured difficulty | 37% [default] | last interval [days] | |||
|---|---|---|---|---|---|---|---|
| repetition number in this series | 0 | memorised on | scheduled repetition | ||||
| scheduled repetition interval | last repetition or drill |
Limbic brain
The middle brain links mainly with our emotions: fear, anger, love, affection, and communication. It’s called the family, or limbic brain. This is the group brain system that started to evolve as we began to socialize. Its goals are sho
Flashcard 1480321535244
| status | not learned | measured difficulty | 37% [default] | last interval [days] | |||
|---|---|---|---|---|---|---|---|
| repetition number in this series | 0 | memorised on | scheduled repetition | ||||
| scheduled repetition interval | last repetition or drill |
Parent (intermediate) annotation
Open itUnder US GAAP, when the seller has completed the significant activities in the earnings process and is either assured of collecting the selling price or able to estimate amounts that will not be collected, a sale of real estate is reported at the time of sale using the normal reve
Original toplevel document
3.2.2. Installment Salesfor some installment sales. An example of such deferral arises for certain sales of real estate on an installment basis. Revenue recognition for sales of real estate varies depending on specific aspects of the sale transaction.19 <span>Under US GAAP, when the seller has completed the significant activities in the earnings process and is either assured of collecting the selling price or able to estimate amounts that will not be collected, a sale of real estate is reported at the time of sale using the normal revenue recognition conditions.20 When those two conditions are not fully met, under US GAAP some of the profit is deferred. Two of the methods may be appropriate in these limited circumstances and relate to the amou
Flashcard 1636520037644
| status | not learned | measured difficulty | 37% [default] | last interval [days] | |||
|---|---|---|---|---|---|---|---|
| repetition number in this series | 0 | memorised on | scheduled repetition | ||||
| scheduled repetition interval | last repetition or drill |
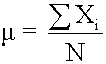
Subject 4. Measures of Center Tendency
represent all the observations in the data set. Population Mean The population mean is the average for a finite population. It is unique; a given population has only one mean. <span>where: N = the number of observations in the entire population X i = the ith observation ΣX i = add up X i , where i is from 0 to N Sample Mean The sample mean is the average for a sample. It is a statistic and is used to estimate the population mean.
Flashcard 1636540484876
| status | not learned | measured difficulty | 37% [default] | last interval [days] | |||
|---|---|---|---|---|---|---|---|
| repetition number in this series | 0 | memorised on | scheduled repetition | ||||
| scheduled repetition interval | last repetition or drill |
Subject 4. Measures of Center Tendency
(return) of an investment over a number of periods. All interval and ratio data sets (e.g., incomes, ages, rates of return) have an arithmetic mean. All data values are considered and included in the arithmetic mean computation. <span>A data set has only one arithmetic mean. This indicates that the mean is unique. The arithmetic mean is the only measure of central tendency where the sum of the deviations of each value from the mean is always zero. Deviation from the arithmetic mean is the distanc
Flashcard 1644576247052
| status | not learned | measured difficulty | 37% [default] | last interval [days] | |||
|---|---|---|---|---|---|---|---|
| repetition number in this series | 0 | memorised on | scheduled repetition | ||||
| scheduled repetition interval | last repetition or drill |
Article 1646881017100
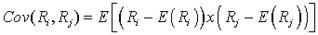
Subject 7. Covariance and Correlation
#has-images #reading-9-probability-concepts
Variance and standard deviation measure the dispersion of a single random variable. Often times, we want to know the relationship between two variables. For example, what is the relationship between the performance of the S&P 500 and that of U.S. long-term corporate bonds? We can use covariance and correlation to measure the degree to which two random variables are related to each other. Given two random variables, R i and R j , the covariance between the two variables is: Facts about covariance: Covariance of returns is negative if, when the return on one asset is above its expected value, the return on the other asset is below its expected value (an average inverse relationship between returns). Covariance of returns is 0 if returns on the assets are unrelated. Covariance of returns is positive if, when the return on one asset is above its expected value, the return on the other asset is above its expected value (an average positive relationship between returns). The cov
| status | not read | reprioritisations | ||
|---|---|---|---|---|
| last reprioritisation on | suggested re-reading day | |||
| started reading on | finished reading on |
Subject 7. Covariance and Correlation
Variance and standard deviation measure the dispersion of a single random variable. Often times, we want to know the relationship between two variables. For example, what is the relationship between the performance of the S&P 500 and that of U.S. long-term corporate bonds? We can use covariance and correlation to measure the degree to which two random variables are related to each other. Given two random variables, R i and R j , the covariance between the two variables is: Facts about covariance: Covarian
Flashcard 1646888881420
| status | not learned | measured difficulty | 37% [default] | last interval [days] | |||
|---|---|---|---|---|---|---|---|
| repetition number in this series | 0 | memorised on | scheduled repetition | ||||
| scheduled repetition interval | last repetition or drill |
Subject 7. Covariance and Correlation
, what is the relationship between the performance of the S&P 500 and that of U.S. long-term corporate bonds? We can use covariance and correlation to measure the degree to which two random variables are related to each other. <span>Given two random variables, R i and R j , the covariance between the two variables is: Facts about covariance: Covariance of returns is negative if, when the return on one asset is above its expected value, the return o
, what is the relationship between the performance of the S&P 500 and that of U.S. long-term corporate bonds? We can use covariance and correlation to measure the degree to which two random variables are related to each other. <span>Given two random variables, R i and R j , the covariance between the two variables is: Facts about covariance: Covariance of returns is negative if, when the return on one asset is above its expected value, the return o
Flashcard 1646892027148
| status | not learned | measured difficulty | 37% [default] | last interval [days] | |||
|---|---|---|---|---|---|---|---|
| repetition number in this series | 0 | memorised on | scheduled repetition | ||||
| scheduled repetition interval | last repetition or drill |
Subject 7. Covariance and Correlation
e degree to which two random variables are related to each other. Given two random variables, R i and R j , the covariance between the two variables is: Facts about covariance: <span>Covariance of returns is negative if, when the return on one asset is above its expected value, the return on the other asset is below its expected value (an average inverse relationship between returns). Covariance of returns is 0 if returns on the assets are unrelated. Covariance of returns is positive if, when the return on one asset is above its expected value, the return on the othe
e degree to which two random variables are related to each other. Given two random variables, R i and R j , the covariance between the two variables is: Facts about covariance: <span>Covariance of returns is negative if, when the return on one asset is above its expected value, the return on the other asset is below its expected value (an average inverse relationship between returns). Covariance of returns is 0 if returns on the assets are unrelated. Covariance of returns is positive if, when the return on one asset is above its expected value, the return on the othe
Flashcard 1646894386444
| status | not learned | measured difficulty | 37% [default] | last interval [days] | |||
|---|---|---|---|---|---|---|---|
| repetition number in this series | 0 | memorised on | scheduled repetition | ||||
| scheduled repetition interval | last repetition or drill |
Subject 7. Covariance and Correlation
Facts about covariance: Covariance of returns is negative if, when the return on one asset is above its expected value, the return on the other asset is below its expected value (an average inverse relationship between returns). <span>Covariance of returns is 0 if returns on the assets are unrelated. Covariance of returns is positive if, when the return on one asset is above its expected value, the return on the other asset is above its expected value (an average positive relationsh
Facts about covariance: Covariance of returns is negative if, when the return on one asset is above its expected value, the return on the other asset is below its expected value (an average inverse relationship between returns). <span>Covariance of returns is 0 if returns on the assets are unrelated. Covariance of returns is positive if, when the return on one asset is above its expected value, the return on the other asset is above its expected value (an average positive relationsh
Flashcard 1646896745740
| status | not learned | measured difficulty | 37% [default] | last interval [days] | |||
|---|---|---|---|---|---|---|---|
| repetition number in this series | 0 | memorised on | scheduled repetition | ||||
| scheduled repetition interval | last repetition or drill |
Subject 7. Covariance and Correlation
tive if, when the return on one asset is above its expected value, the return on the other asset is below its expected value (an average inverse relationship between returns). Covariance of returns is 0 if returns on the assets are unrelated. <span>Covariance of returns is positive if, when the return on one asset is above its expected value, the return on the other asset is above its expected value (an average positive relationship between returns). The covariance of a random variable with itself (own covariance) is its own variance. Example Suppose that the future short-term outlook for the economy is favorable w
tive if, when the return on one asset is above its expected value, the return on the other asset is below its expected value (an average inverse relationship between returns). Covariance of returns is 0 if returns on the assets are unrelated. <span>Covariance of returns is positive if, when the return on one asset is above its expected value, the return on the other asset is above its expected value (an average positive relationship between returns). The covariance of a random variable with itself (own covariance) is its own variance. Example Suppose that the future short-term outlook for the economy is favorable w
Flashcard 1646899105036
| status | not learned | measured difficulty | 37% [default] | last interval [days] | |||
|---|---|---|---|---|---|---|---|
| repetition number in this series | 0 | memorised on | scheduled repetition | ||||
| scheduled repetition interval | last repetition or drill |
Subject 7. Covariance and Correlation
returns on the assets are unrelated. Covariance of returns is positive if, when the return on one asset is above its expected value, the return on the other asset is above its expected value (an average positive relationship between returns). <span>The covariance of a random variable with itself (own covariance) is its own variance. Example Suppose that the future short-term outlook for the economy is favorable with a probability 0.6 and unfavorable with a probability of 0.4. For two stocks, F and
returns on the assets are unrelated. Covariance of returns is positive if, when the return on one asset is above its expected value, the return on the other asset is above its expected value (an average positive relationship between returns). <span>The covariance of a random variable with itself (own covariance) is its own variance. Example Suppose that the future short-term outlook for the economy is favorable with a probability 0.6 and unfavorable with a probability of 0.4. For two stocks, F and
Flashcard 1646905396492
| status | not learned | measured difficulty | 37% [default] | last interval [days] | |||
|---|---|---|---|---|---|---|---|
| repetition number in this series | 0 | memorised on | scheduled repetition | ||||
| scheduled repetition interval | last repetition or drill |
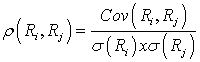
Subject 7. Covariance and Correlation
where. The correlation between two random variables, R i and R j , is defined as: Alternative notations are corr(R i , R j ) and ρ ij . Properties of correlation: <span>Correlation is a number between -1 and +1. A correlation of 0 indicates an absence of any linear (straight-line) relationship between the variables. Increasingly positive correlation indicates an increasingly strong positive lin
where. The correlation between two random variables, R i and R j , is defined as: Alternative notations are corr(R i , R j ) and ρ ij . Properties of correlation: <span>Correlation is a number between -1 and +1. A correlation of 0 indicates an absence of any linear (straight-line) relationship between the variables. Increasingly positive correlation indicates an increasingly strong positive lin
Flashcard 1646907755788
| status | not learned | measured difficulty | 37% [default] | last interval [days] | |||
|---|---|---|---|---|---|---|---|
| repetition number in this series | 0 | memorised on | scheduled repetition | ||||
| scheduled repetition interval | last repetition or drill |
Subject 7. Covariance and Correlation
two random variables, R i and R j , is defined as: Alternative notations are corr(R i , R j ) and ρ ij . Properties of correlation: Correlation is a number between -1 and +1. <span>A correlation of 0 indicates an absence of any linear (straight-line) relationship between the variables. Increasingly positive correlation indicates an increasingly strong positive linear relationship (up to 1, which indicates a perfect linear relationship). Increasingly negative correlati
two random variables, R i and R j , is defined as: Alternative notations are corr(R i , R j ) and ρ ij . Properties of correlation: Correlation is a number between -1 and +1. <span>A correlation of 0 indicates an absence of any linear (straight-line) relationship between the variables. Increasingly positive correlation indicates an increasingly strong positive linear relationship (up to 1, which indicates a perfect linear relationship). Increasingly negative correlati
Flashcard 1646910115084
| status | not learned | measured difficulty | 37% [default] | last interval [days] | |||
|---|---|---|---|---|---|---|---|
| repetition number in this series | 0 | memorised on | scheduled repetition | ||||
| scheduled repetition interval | last repetition or drill |
Subject 7. Covariance and Correlation
otations are corr(R i , R j ) and ρ ij . Properties of correlation: Correlation is a number between -1 and +1. A correlation of 0 indicates an absence of any linear (straight-line) relationship between the variables. <span>Increasingly positive correlation indicates an increasingly strong positive linear relationship (up to 1, which indicates a perfect linear relationship). Increasingly negative correlation indicates an increasingly strong negative linear relationship (down to -1, which indicates a perfect inverse linear relationship). The correlati
otations are corr(R i , R j ) and ρ ij . Properties of correlation: Correlation is a number between -1 and +1. A correlation of 0 indicates an absence of any linear (straight-line) relationship between the variables. <span>Increasingly positive correlation indicates an increasingly strong positive linear relationship (up to 1, which indicates a perfect linear relationship). Increasingly negative correlation indicates an increasingly strong negative linear relationship (down to -1, which indicates a perfect inverse linear relationship). The correlati
Flashcard 1646912474380
| status | not learned | measured difficulty | 37% [default] | last interval [days] | |||
|---|---|---|---|---|---|---|---|
| repetition number in this series | 0 | memorised on | scheduled repetition | ||||
| scheduled repetition interval | last repetition or drill |
Subject 7. Covariance and Correlation
0 indicates an absence of any linear (straight-line) relationship between the variables. Increasingly positive correlation indicates an increasingly strong positive linear relationship (up to 1, which indicates a perfect linear relationship). <span>Increasingly negative correlation indicates an increasingly strong negative linear relationship (down to -1, which indicates a perfect inverse linear relationship). The correlation between two variables represents the degree to which these variables are related. It is important to keep in mind that correlation does not necessarily mean causat
0 indicates an absence of any linear (straight-line) relationship between the variables. Increasingly positive correlation indicates an increasingly strong positive linear relationship (up to 1, which indicates a perfect linear relationship). <span>Increasingly negative correlation indicates an increasingly strong negative linear relationship (down to -1, which indicates a perfect inverse linear relationship). The correlation between two variables represents the degree to which these variables are related. It is important to keep in mind that correlation does not necessarily mean causat
Flashcard 1646915357964
| status | not learned | measured difficulty | 37% [default] | last interval [days] | |||
|---|---|---|---|---|---|---|---|
| repetition number in this series | 0 | memorised on | scheduled repetition | ||||
| scheduled repetition interval | last repetition or drill |
Subject 7. Covariance and Correlation
ame time. We know that this is the case because both returns are higher in favorable conditions and lower in unfavorable conditions. Had we obtained a negative answer, logic would have told us that we had made an error somewhere. <span>The correlation between two random variables, R i and R j , is defined as: Alternative notations are corr(R i , R j ) and ρ ij . Properties of correlation: Correlation is a number between -1 and
ame time. We know that this is the case because both returns are higher in favorable conditions and lower in unfavorable conditions. Had we obtained a negative answer, logic would have told us that we had made an error somewhere. <span>The correlation between two random variables, R i and R j , is defined as: Alternative notations are corr(R i , R j ) and ρ ij . Properties of correlation: Correlation is a number between -1 and
Flashcard 1646917717260
| status | not learned | measured difficulty | 37% [default] | last interval [days] | |||
|---|---|---|---|---|---|---|---|
| repetition number in this series | 0 | memorised on | scheduled repetition | ||||
| scheduled repetition interval | last repetition or drill |
Subject 7. Covariance and Correlation
relationship (up to 1, which indicates a perfect linear relationship). Increasingly negative correlation indicates an increasingly strong negative linear relationship (down to -1, which indicates a perfect inverse linear relationship). <span>The correlation between two variables represents the degree to which these variables are related. It is important to keep in mind that correlation does not necessarily mean causation. For example, there is a high positive relationship between the number of fire-fighters sent to a fi
relationship (up to 1, which indicates a perfect linear relationship). Increasingly negative correlation indicates an increasingly strong negative linear relationship (down to -1, which indicates a perfect inverse linear relationship). <span>The correlation between two variables represents the degree to which these variables are related. It is important to keep in mind that correlation does not necessarily mean causation. For example, there is a high positive relationship between the number of fire-fighters sent to a fi
| status | not read | reprioritisations | ||
|---|---|---|---|---|
| last reprioritisation on | suggested re-reading day | |||
| started reading on | finished reading on |
Subject 7. Covariance and Correlation
elation indicates an increasingly strong negative linear relationship (down to -1, which indicates a perfect inverse linear relationship). The correlation between two variables represents the degree to which these variables are related. <span>It is important to keep in mind that correlation does not necessarily mean causation. For example, there is a high positive relationship between the number of fire-fighters sent to a fire and the amount of damage done. Does this mean that the fire fighters cause the dama
| status | not read | reprioritisations | ||
|---|---|---|---|---|
| last reprioritisation on | suggested re-reading day | |||
| started reading on | finished reading on |
Subject 7. Covariance and Correlation
= 0.010368. So, correlation = ρ(R f , R g )= cov(R f , R g ) / σ(R f ) x σ(R g ) = 0.010368 / (0.117576 x 0.088182) = 0.99999. This indicates an almost perfect positive linear relationship between R f and R g . <span>Calculate covariance given a joint probability function: We can calculate covariance using the joint probability function of the random variables if that can be estimated. The joint probability function of two random variables, X and Y, denoted P(X, Y), gives the probability of joint occurrences of values X and Y. For example, P(3, 2) is the probability that X equals 3 and Y equals 2. <span><body><html>
Flashcard 1646927678732
| status | not learned | measured difficulty | 37% [default] | last interval [days] | |||
|---|---|---|---|---|---|---|---|
| repetition number in this series | 0 | memorised on | scheduled repetition | ||||
| scheduled repetition interval | last repetition or drill |
factor+pairs - Buscar con Google
:"","st":"Splash Math","th":160,"tu":"https://encrypted-tbn0.gstatic.com/images?q\u003dtbn:ANd9GcRHjBhlW5F0Cb7E8s3_cbzCOwjzEfIhJIdDWFcIRiA-zHAssrk5kxuE1UAu6A","tw":160} <span>A factor pair refers to a set of two numbers, which when multiplied result in a definite number. Factor Pairs - Definition, Examples & Fun Math Worksheets https://www.splashmath.com/math-vocabulary/fractions/factor-pairs Feedback About this result People also a
:"","st":"Splash Math","th":160,"tu":"https://encrypted-tbn0.gstatic.com/images?q\u003dtbn:ANd9GcRHjBhlW5F0Cb7E8s3_cbzCOwjzEfIhJIdDWFcIRiA-zHAssrk5kxuE1UAu6A","tw":160} <span>A factor pair refers to a set of two numbers, which when multiplied result in a definite number. Factor Pairs - Definition, Examples & Fun Math Worksheets https://www.splashmath.com/math-vocabulary/fractions/factor-pairs Feedback About this result People also a
| status | not read | reprioritisations | ||
|---|---|---|---|---|
| last reprioritisation on | suggested re-reading day | |||
| started reading on | finished reading on |
https://www.google.com.mx/search?q=factor%2Bmeaning%2Bmathematics&rlz=1C5CHFA_enMX588MX588&oq=factor%2Bmeaning%2Bmathematics&aqs=chrome..69i57j0.5916j0j1&sourceid=chrome&ie=UTF-8
istorySearch help Tools Any time Any time Past hour Past 24 hours Past week Past month Past year Custom range... Customised date range From To All results All results Verbatim About 24,400,000 results (0.52 seconds) Search Results <span>Factor, in mathematics, a number or algebraic expression that divides another number or expression evenly—i.e., with no remainder. For example, 3 and 6 are factors of 12 because 12 ÷ 3 = 4 exactly and 12 ÷ 6 = 2 exactly. factor | mathematics | Britannica.com https://www.britannica.com/topic/factor-mathematics
| status | not read | reprioritisations | ||
|---|---|---|---|---|
| last reprioritisation on | suggested re-reading day | |||
| started reading on | finished reading on |