Edited, memorised or added to reading queue
on 14-Nov-2016 (Mon)
Do you want BuboFlash to help you learning these things? Click here to log in or create user.
| status | not read | reprioritisations | ||
|---|---|---|---|---|
| last reprioritisation on | suggested re-reading day | |||
| started reading on | finished reading on |
| status | not read | reprioritisations | ||
|---|---|---|---|---|
| last reprioritisation on | suggested re-reading day | |||
| started reading on | finished reading on |
Unknown title
Naturales, tendrán los recortes más altos. Esto como parte de varios recortes preventivos anunciados este año, y que se aplicarán el siguiente. También por las disminuciones aplicadas en el proyecto de presupuesto ya aprobado. <span>Deuda El costo financiero de las empresas productivas del Estado como Pemex y CFE alcanzará 120 mil 394 millones de pesos, contra 84 mil 443 millones de 2016, 43 por ciento más que en este año. La Secretaría de Educación Pública tendrá 35 mil 331 millones de pesos menos, pese a que en la reasignación, en comparación con la propuesta del Presupuesto del federal, le otorgan
| status | not read | reprioritisations | ||
|---|---|---|---|---|
| last reprioritisation on | suggested re-reading day | |||
| started reading on | finished reading on |
Unknown title
rollo social permitirá que todos los programas vinculados a padrón tengan la cobertura necesaria.“Los ajustes en mayor medida recaen en los programas y en las empresas productivas del Estado, como aquí habíamos comentado, notablemente Pemex”, <span>dijo. Recortan 16% el presupuesto del campo para 2017 Mínimos recortes al gasto de los poderes Judicial, Legislativo y Ejecutivo Tras 9 horas de debate, concluyen diputados aval del Pre
| status | not read | reprioritisations | ||
|---|---|---|---|---|
| last reprioritisation on | suggested re-reading day | |||
| started reading on | finished reading on |
Subject 5. Revisiting the Consumer's Demand Function
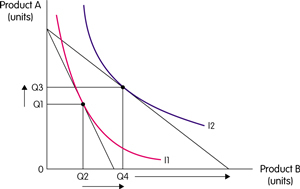
Indifference curve analysis lies behind a demand curve. It can be used to examine the effect of price changes and income changes. If the price of B now falls, the budget line will pivot. The consumer now maximises utility consuming Q3 of product A and Q4 of product B. The fall in the price of product B has led to an increase in the quantity demanded of Q2Q4. This can be shown on a demand curve. There are two different phenomena underlying a consumer's response to a price drop: As the price of a product d
| status | not read | reprioritisations | ||
|---|---|---|---|---|
| last reprioritisation on | suggested re-reading day | |||
| started reading on | finished reading on |
Subject 5. Revisiting the Consumer's Demand Function
o an increase in the quantity demanded of Q2Q4. This can be shown on a demand curve. There are two different phenomena underlying a consumer's response to a price drop: <span>As the price of a product declines, the lower opportunity cost will induce consumers to buy more of it since it becomes less expensive - even if they have to give up other products. This is called the substitution effect. To isolate this effect diagrammatically, we move the new budget line inwards and parallel until it is tangent to the old indifference curve. The new slope reflects
| status | not read | reprioritisations | ||
|---|---|---|---|---|
| last reprioritisation on | suggested re-reading day | |||
| started reading on | finished reading on |
Subject 5. Revisiting the Consumer's Demand Function
lope reflects the new relative prices but the utility is the same as it was originally. The substitution effect is Q2Q6. The substitution effect will always lead to more of the relatively cheaper product being demanded. <span>With a fixed amount of money income, a reduction in the price of a product will increase a consumer's real income - the amount of goods and services consumers are able to purchase. Typically, consumers will respond by purchasing more of the cheaper products (as well as other products). This is called the income effect. The income effect is identified by shifting the budget line back outwards again. In this case, this leads to an increase in the quantity demanded of Q6 Q4. The substitution and income effects will generally work in the same direction, causing consumers to purchase more as the price falls and less as the price rises. Th
| status | not read | reprioritisations | ||
|---|---|---|---|---|
| last reprioritisation on | suggested re-reading day | |||
| started reading on | finished reading on |
Parent (intermediate) annotation
Open itMarket Equilibrium Equilibrium is a state in which conflicting forces are in balance. In equilibrium, it will be possible for both buyers and sellers to realize their goals simultaneously. The following graph depicts the market supply and demand for concert tickets at Madison Square Garden in New York City. Equilibrium price and quantity are where the supply and demand curves intersect. Draw a horizontal line from the intersection to the price axis. This is equilibrium price: $60. Draw a vertical line from the intersection to the quantity axis. This is equilibrium quantity: 300. It is equilibrium because quantity demanded equals quantity supplied at $60 per ticket. At this price, there is neither surplus (excess supply) nor shortage (excess demand), so there is no downward or upward pressure for the price to change. Surplus will push prices downward towards equilibrium. Suppose the price is initially above the equilibrium price (P 2 ) and sits at P 1 . Quantity supplied (Q 1s ) will exceed quantity demanded (Q 1D ), creating a surplus. The surplus will put downward pressure on prices since producers will begin to lower their prices to sell the surplus. As a result, the price will fall, the quantity supplied will decrease, and the quantity demanded will increase until the equilibrium price (P 2 ) is restored. This process involves movements along supply-and-demand curves since the changes are caused by price fluctuations. Similarly, shortages push prices upward towards equilibrium. Because the price rises if it is below equilibrium, falls if it is above equilibrium, and remains constant if it is at equilibrium, the price is pulled toward equilibrium and remains there until some event changes the equilibrium. We refer to such an equilibrium as being stable because whenever price is disturbed away from the equilibrium, it tends to converge back to that equilibrium. An unstable equilibrium is an equilibrium that is not restored if disrupted by an external force. While most equilibria studied in economics are of the stable variety, a few cases of unstable equilibria do emerge from time to time, in limited circumstances.
Original toplevel document
Subject 3. Market Equilibrium; Market quantity is the sum of individual quantities supplied at each price. At a price of $2.00, Ann supplies 4, Barry supplies 3, and Charlie supplies 0. The market supply is 7. <span>Market Equilibrium Equilibrium is a state in which conflicting forces are in balance. In equilibrium, it will be possible for both buyers and sellers to realize their goals simultaneously. The following graph depicts the market supply and demand for concert tickets at Madison Square Garden in New York City. Equilibrium price and quantity are where the supply and demand curves intersect. Draw a horizontal line from the intersection to the price axis. This is equilibrium price: $60. Draw a vertical line from the intersection to the quantity axis. This is equilibrium quantity: 300. It is equilibrium because quantity demanded equals quantity supplied at $60 per ticket. At this price, there is neither surplus (excess supply) nor shortage (excess demand), so there is no downward or upward pressure for the price to change. Surplus will push prices downward towards equilibrium. Suppose the price is initially above the equilibrium price (P 2 ) and sits at P 1 . Quantity supplied (Q 1s ) will exceed quantity demanded (Q 1D ), creating a surplus. The surplus will put downward pressure on prices since producers will begin to lower their prices to sell the surplus. As a result, the price will fall, the quantity supplied will decrease, and the quantity demanded will increase until the equilibrium price (P 2 ) is restored. This process involves movements along supply-and-demand curves since the changes are caused by price fluctuations. Similarly, shortages push prices upward towards equilibrium. Because the price rises if it is below equilibrium, falls if it is above equilibrium, and remains constant if it is at equilibrium, the price is pulled toward equilibrium and remains there until some event changes the equilibrium. We refer to such an equilibrium as being stable because whenever price is disturbed away from the equilibrium, it tends to converge back to that equilibrium. An unstable equilibrium is an equilibrium that is not restored if disrupted by an external force. While most equilibria studied in economics are of the stable variety, a few cases of unstable equilibria do emerge from time to time, in limited circumstances.<span><body><html>
| status | not read | reprioritisations | ||
|---|---|---|---|---|
| last reprioritisation on | suggested re-reading day | |||
| started reading on | finished reading on |
Subject 4. Auctions
Auctions can be used to arrive at equilibrium price. Auctions can have bidders trying to buy an item (e.g., Christie's, eBay). Auctions can have bidders trying to sell an item (e.g., Procurement, priceline.com). Auctions can be classified as one of two types: Common value auction: the value of the item is the same to everyone but different bidders have different estimates about the underlying value. Examples: oil, timber, items with resale value. Private value auction: bidders know the value of the item to themselves with certainty but there is uncertainty regarding other bidders' values. Examples: collectibles, art items. There are also many different methods for auctioning items: Open outcry English (ascending price) auction: The auctioneer starts at a reserve price and increases the price until only one bidder is left. That bidder wins the auction at the current price. First-price sealed-bid auction: Everyone writes down a bid in secret. The person with the highest bid wins the object and pays what he bids. Second-price sealed-bid (Vickery) auction: Everyone writes down a bid in secret. The person with the highest bid wins the object and pays the second highest bid (used for stamps and by Goethe). Dutch (descending price) auction: The auctioneer starts at a high price and decreases the price until a bidder accepts the price. The winner's curse means that the winner of an auction will frequently have bid too much for the auctioned item: you win, you lose money, and you curse. A Dutch auction share repurchase is when a company agrees to buy back a fixed amount of its outstanding shares within a certain price range. Offers come in from investors who specify the price within the given range at which they'll sell their shares. The company then buys back the shares of those who bid the lowest first and continues on up the line until they have bought back the amount that they said they would. The U. S. Treasury security auctions are conducted using the single-price auction method. All successful competitive bidders and all noncompetitive bidders are awarded securities at the price equivalent to the highest rate or yield of accepted competitive tenders.
| status | not read | reprioritisations | ||
|---|---|---|---|---|
| last reprioritisation on | suggested re-reading day | |||
| started reading on | finished reading on |
Subject 1. Types of Profit Measures
Accounting Profit Accounting profit is the profit used by accountants to determine a firm's net income. Accounting profit = Total revenue - Total accounting costs Economic profit equals a firm's total revenue minus its total opportunity costs of production. Economic profit = Total revenue - Total op
| status | not read | reprioritisations | ||
|---|---|---|---|---|
| last reprioritisation on | suggested re-reading day | |||
| started reading on | finished reading on |
Subject 1. Types of Profit Measures
tal accounting costs Economic profit equals a firm's total revenue minus its total opportunity costs of production. Economic profit = Total revenue - Total opportunity costs <span>The total opportunity costs include both explicit and implicit costs of all the resources used by a firm. Implicit opportunity cost is the unearned or nominal profit that the resource-owner did not make from investing in the next best alternative. As a result, you can have a significant accounting profit with little to no economic profit. Example Suppose a person uses his own resources, land, capital, and time in the production of goods. The opportunity costs of these resources are shown below: Accounting Profit = $55,000 Entrepreneur's own forgone salary = $40,000 Foregone interest on capital = $1,000 Foregone rent = $2,000 Economic Profit = 55,000 - 40,000 - 1,000 - 2,000 = $12,000 For publicly traded corporations, economic profit is accounting profit - required return on equity capital. When economic profit is zero, a firm's acco
| status | not read | reprioritisations | ||
|---|---|---|---|---|
| last reprioritisation on | suggested re-reading day | |||
| started reading on | finished reading on |
Subject 1. Types of Profit Measures
Accounting Profit Accounting profit is the profit used by accountants to determine a firm's net income. Accounting profit = Total revenue - Total accounting costs Economic profit equals a firm's total revenue minus its total opportunity costs of production. Economic profit = Total revenue - Total opportunity costs The total opportunity costs include both explicit and implicit costs of all the resources used by a firm. Implicit opportunity cost is the unearned or nominal profi
| status | not read | reprioritisations | ||
|---|---|---|---|---|
| last reprioritisation on | suggested re-reading day | |||
| started reading on | finished reading on |
Subject 1. Types of Profit Measures
#13; When economic profit is zero, a firm's accounting profit becomes normal profit, which is effectively the total implicit opportunity cost. Accounting profit = Economic profit + Normal profit <span>When a firm's total revenues are just equal to its total costs, its economic profit is zero, but it still makes accounting profit. Zero economic profit does not mean that the firm is about to go out of business. Instead, it just indicates that the owners are receiving exactly the market (normal) rate of return on their investment. Economic Rent The total income received by an owner of a factor of production is made up of its economic rent and its opportunity cost. 
| status | not read | reprioritisations | ||
|---|---|---|---|---|
| last reprioritisation on | suggested re-reading day | |||
| started reading on | finished reading on |
Subject 1. Types of Profit Measures
s accounting profit. Zero economic profit does not mean that the firm is about to go out of business. Instead, it just indicates that the owners are receiving exactly the market (normal) rate of return on their investment. <span>Economic Rent The total income received by an owner of a factor of production is made up of its economic rent and its opportunity cost. Economic rent is the income received by the owner of a factor of production over and above the amount required to induce that owner to offer the factor for use. The opportunity cost of using a factor is the income required to induce its owner to offer the resource for use, which is the value of the factor in its next best use. The following figure illustrates the division of a factor income into economic rent and opportunity cost. The portion of income comprised of economic rent depends upon the elasticity of supply for the factor.