Edited, memorised or added to reading queue
on 23-Jul-2017 (Sun)
Do you want BuboFlash to help you learning these things? Click here to log in or create user.
Flashcard 1621391707404
| status | not learned | measured difficulty | 37% [default] | last interval [days] | |||
|---|---|---|---|---|---|---|---|
| repetition number in this series | 0 | memorised on | scheduled repetition | ||||
| scheduled repetition interval | last repetition or drill |
Flashcard 1633823362316
| status | not learned | measured difficulty | 37% [default] | last interval [days] | |||
|---|---|---|---|---|---|---|---|
| repetition number in this series | 0 | memorised on | scheduled repetition | ||||
| scheduled repetition interval | last repetition or drill |
Subject 5. Bond Equivalent Yield
Periodic bond yields for both straight and zero-coupon bonds are conventionally computed based on semi-annual periods, as U.S. bonds typically make two coupon payments per year. For example, a zero-coupon bond with a maturity of five years will mature in 10 6-month periods. The periodic yield for that
Flashcard 1636484648204
| status | not learned | measured difficulty | 37% [default] | last interval [days] | |||
|---|---|---|---|---|---|---|---|
| repetition number in this series | 0 | memorised on | scheduled repetition | ||||
| scheduled repetition interval | last repetition or drill |
Subject 3. Frequency Distributions
f graphically displaying data. It is similar to a histogram but the bars are replaced by a line joined together. It is constructed in the following manner: Absolute frequency for each interval is plotted on the vertical (y) axis. <span>The midpoint of each class (interval) is shown on the horizontal (x) axis. Neighboring points are connected with a straight line. Unlike a histogram, a frequency polygon adds a degree of continuity to the presentation of the distribution. It
Flashcard 1636822027532
| status | not learned | measured difficulty | 37% [default] | last interval [days] | |||
|---|---|---|---|---|---|---|---|
| repetition number in this series | 0 | memorised on | scheduled repetition | ||||
| scheduled repetition interval | last repetition or drill |
Parent (intermediate) annotation
Open itIn a frequency distribution It is important to consider the number of intervals to be used. If too few intervals are used, too much data may be summarized and we may lose important characteristics; if too many intervals are used, we may not summarize enough.
Original toplevel document
Subject 3. Frequency Distributionsthat: Each observation can only lie in one interval. The total number of intervals will incorporate the whole population. The range for an interval is unique. This means a value (observation) can only fall into one interval. <span>It is important to consider the number of intervals to be used. If too few intervals are used, too much data may be summarized and we may lose important characteristics; if too many intervals are used, we may not summarize enough. A frequency distribution is constructed by dividing the scores into intervals and counting the number of scores in each interval. The actual number of scores and the percent
Flashcard 1636830416140
| status | not learned | measured difficulty | 37% [default] | last interval [days] | |||
|---|---|---|---|---|---|---|---|
| repetition number in this series | 0 | memorised on | scheduled repetition | ||||
| scheduled repetition interval | last repetition or drill |
Parent (intermediate) annotation
Open itThe following steps are required when organizing data into a frequency distribution together with suggestions on constructing the frequency distribution. Identify the highest and lowest values of the observations. Setup classes (groups into which data is divided). The classes must be mutually exclusive and of equal size. Add up the number of observations and assign
Original toplevel document
Subject 3. Frequency Distributionsby the total number of observations. Cumulative absolute frequency and cumulative relative frequency are the results from cumulating the absolute and relative frequencies as we move from the first to the last interval. <span>The following steps are required when organizing data into a frequency distribution together with suggestions on constructing the frequency distribution. Identify the highest and lowest values of the observations. Setup classes (groups into which data is divided). The classes must be mutually exclusive and of equal size. Add up the number of observations and assign each observation to its class. Count the number of observations in each class. This is called the class frequency. Data can be divided into two types: discrete and continuous. Discrete: The values in the data set can be counted. There are distinct spaces between the values, such as
Flashcard 1640946339084
| status | not learned | measured difficulty | 37% [default] | last interval [days] | |||
|---|---|---|---|---|---|---|---|
| repetition number in this series | 0 | memorised on | scheduled repetition | ||||
| scheduled repetition interval | last repetition or drill |
Daily Current Affairs for IAS UPSC Exam Preparation – Civilsdaily
recommendations Better monitoring of funds allocated. Centre and states to finalize an annual work plan and budget for RTE in alignment with the Union budget for better coordination and utilization. Back2basics The RTE Act, 2009 <span>The RTE Act, 2009 envisages free and compulsory elementary education to every child in the age group of 6-14 years . The section 23(2) of the Act specifies that all teachers at elementary level at commencement of this law if did not possess minimum qualifications under it need to acquire these w
recommendations Better monitoring of funds allocated. Centre and states to finalize an annual work plan and budget for RTE in alignment with the Union budget for better coordination and utilization. Back2basics The RTE Act, 2009 <span>The RTE Act, 2009 envisages free and compulsory elementary education to every child in the age group of 6-14 years . The section 23(2) of the Act specifies that all teachers at elementary level at commencement of this law if did not possess minimum qualifications under it need to acquire these w
| status | not read | reprioritisations | ||
|---|---|---|---|---|
| last reprioritisation on | suggested re-reading day | |||
| started reading on | finished reading on |
Daily Current Affairs for IAS UPSC Exam Preparation – Civilsdaily
s reforms and modernization The WCO maintains the international Harmonized System (HS) goods nomenclature, and administers the technical aspects of the World Trade Organization (WTO) Agreements on Customs Valuation and Rules of Origin <span>Trade Facilitation Agreement (TFA) The TFA is the WTO’s first-ever multilateral accord that aims to simplify customs regulations for the cross-border movement of goods. It was outcome of WTO’s 9th Bali (Indonesia) ministerial package of 2013 The agreement includes provisions for Lowering import tariffs and agricultural subsidies: It will make it easier for developing countries to trade with the developed world in global markets Abolish hard import quotas: Developed countries would abolish hard import quotas on agricultural products from the developing world and instead would only be allowed to charge tariffs on amount of agricultural imports exceeding specific limits Reduction in red tape at international borders: It aims to reduce red-tapism to facilitate trade by reforming customs bureaucracies and formalities. The Hindu July 22, 2017 [op-ed snap] The need for lateral entry in civil services [imagelink] Image source Note4studert
Flashcard 1641148976396
| status | not learned | measured difficulty | 37% [default] | last interval [days] | |||
|---|---|---|---|---|---|---|---|
| repetition number in this series | 0 | memorised on | scheduled repetition | ||||
| scheduled repetition interval | last repetition or drill |
| status | not read | reprioritisations | ||
|---|---|---|---|---|
| last reprioritisation on | suggested re-reading day | |||
| started reading on | finished reading on |
| status | not read | reprioritisations | ||
|---|---|---|---|---|
| last reprioritisation on | suggested re-reading day | |||
| started reading on | finished reading on |
Dollar-Cost Averaging (DCA)
What is 'Dollar-Cost Averaging - DCA' <span>Dollar-cost averaging (DCA) is an investment technique of buying a fixed dollar amount of a particular investment on a regular schedule, regardless of the share price. The investor purchases more shares when prices are low and fewer shares when prices are high. The premise is that DCA lowers the average share cost over time, increasing the opportunity to profit. The DCA technique does not guarantee that an investor won't lose money on investments. Rather, it is meant to allow investment over time instead of investment as a lump sum. BREAKING DOWN 'Dollar-Cost Averaging - DCA' Fundamental to the strategy is a commitment to investing a fixed dollar amount each month. Depending
Flashcard 1641157102860
| status | not learned | measured difficulty | 37% [default] | last interval [days] | |||
|---|---|---|---|---|---|---|---|
| repetition number in this series | 0 | memorised on | scheduled repetition | ||||
| scheduled repetition interval | last repetition or drill |
Flashcard 1641158937868
| status | not learned | measured difficulty | 37% [default] | last interval [days] | |||
|---|---|---|---|---|---|---|---|
| repetition number in this series | 0 | memorised on | scheduled repetition | ||||
| scheduled repetition interval | last repetition or drill |
Flashcard 1641160772876

| status | not learned | measured difficulty | 37% [default] | last interval [days] | |||
|---|---|---|---|---|---|---|---|
| repetition number in this series | 0 | memorised on | scheduled repetition | ||||
| scheduled repetition interval | last repetition or drill |
Parent (intermediate) annotation
Open itrs x i (where i = 1, 2, ..., n) is: The special cases of n = 2 and n = 3 are given by: and so on. <span>For n = 2, the harmonic mean is related to arithmetic mean A and geometric mean G by: <span><body><html>
Original toplevel document
Subject 4. Measures of Center Tendency, therefore, is not recommended for use as the only measure of central tendency. A further disadvantage of the mode is that many distributions have more than one mode. These distributions are called "multimodal." <span>Harmonic Mean The harmonic mean of n numbers x i (where i = 1, 2, ..., n) is: The special cases of n = 2 and n = 3 are given by: and so on. For n = 2, the harmonic mean is related to arithmetic mean A and geometric mean G by: The mean, median, and mode are equal in symmetric distributions. The mean is higher than the median in positively skewed distributions and lower than the median in negatively skewed dist
Flashcard 1641163132172


| status | not learned | measured difficulty | 37% [default] | last interval [days] | |||
|---|---|---|---|---|---|---|---|
| repetition number in this series | 0 | memorised on | scheduled repetition | ||||
| scheduled repetition interval | last repetition or drill |
Parent (intermediate) annotation
Open itHarmonic Mean The harmonic mean of n numbers x i (where i = 1, 2, ..., n) is: The special cases of n = 2 and n = 3 are given by: and so on. For n = 2, the harmonic mean is related to arithmetic mean A and geometric mea
Original toplevel document
Subject 4. Measures of Center Tendency, therefore, is not recommended for use as the only measure of central tendency. A further disadvantage of the mode is that many distributions have more than one mode. These distributions are called "multimodal." <span>Harmonic Mean The harmonic mean of n numbers x i (where i = 1, 2, ..., n) is: The special cases of n = 2 and n = 3 are given by: and so on. For n = 2, the harmonic mean is related to arithmetic mean A and geometric mean G by: The mean, median, and mode are equal in symmetric distributions. The mean is higher than the median in positively skewed distributions and lower than the median in negatively skewed dist
Flashcard 1641164705036


| status | not learned | measured difficulty | 37% [default] | last interval [days] | |||
|---|---|---|---|---|---|---|---|
| repetition number in this series | 0 | memorised on | scheduled repetition | ||||
| scheduled repetition interval | last repetition or drill |
Parent (intermediate) annotation
Open itHarmonic Mean The harmonic mean of n numbers x i (where i = 1, 2, ..., n) is: The special cases of n = 2 and n = 3 are given by: and so on. For n = 2, the harmonic mean is related to arithmetic mean A and geometric mea
Original toplevel document
Subject 4. Measures of Center Tendency, therefore, is not recommended for use as the only measure of central tendency. A further disadvantage of the mode is that many distributions have more than one mode. These distributions are called "multimodal." <span>Harmonic Mean The harmonic mean of n numbers x i (where i = 1, 2, ..., n) is: The special cases of n = 2 and n = 3 are given by: and so on. For n = 2, the harmonic mean is related to arithmetic mean A and geometric mean G by: The mean, median, and mode are equal in symmetric distributions. The mean is higher than the median in positively skewed distributions and lower than the median in negatively skewed dist
Flashcard 1641167588620
| status | not learned | measured difficulty | 37% [default] | last interval [days] | |||
|---|---|---|---|---|---|---|---|
| repetition number in this series | 0 | memorised on | scheduled repetition | ||||
| scheduled repetition interval | last repetition or drill |
| status | not read | reprioritisations | ||
|---|---|---|---|---|
| last reprioritisation on | suggested re-reading day | |||
| started reading on | finished reading on |
Flashcard 1641171520780
| status | not learned | measured difficulty | 37% [default] | last interval [days] | |||
|---|---|---|---|---|---|---|---|
| repetition number in this series | 0 | memorised on | scheduled repetition | ||||
| scheduled repetition interval | last repetition or drill |
Flashcard 1641173355788
| status | not learned | measured difficulty | 37% [default] | last interval [days] | |||
|---|---|---|---|---|---|---|---|
| repetition number in this series | 0 | memorised on | scheduled repetition | ||||
| scheduled repetition interval | last repetition or drill |
Flashcard 1641175190796
| status | not learned | measured difficulty | 37% [default] | last interval [days] | |||
|---|---|---|---|---|---|---|---|
| repetition number in this series | 0 | memorised on | scheduled repetition | ||||
| scheduled repetition interval | last repetition or drill |
Flashcard 1641179909388
| status | not learned | measured difficulty | 37% [default] | last interval [days] | |||
|---|---|---|---|---|---|---|---|
| repetition number in this series | 0 | memorised on | scheduled repetition | ||||
| scheduled repetition interval | last repetition or drill |
Flashcard 1641181744396
| status | not learned | measured difficulty | 37% [default] | last interval [days] | |||
|---|---|---|---|---|---|---|---|
| repetition number in this series | 0 | memorised on | scheduled repetition | ||||
| scheduled repetition interval | last repetition or drill |
Flashcard 1641183579404
| status | not learned | measured difficulty | 37% [default] | last interval [days] | |||
|---|---|---|---|---|---|---|---|
| repetition number in this series | 0 | memorised on | scheduled repetition | ||||
| scheduled repetition interval | last repetition or drill |
Flashcard 1641185414412
| status | not learned | measured difficulty | 37% [default] | last interval [days] | |||
|---|---|---|---|---|---|---|---|
| repetition number in this series | 0 | memorised on | scheduled repetition | ||||
| scheduled repetition interval | last repetition or drill |
| status | not read | reprioritisations | ||
|---|---|---|---|---|
| last reprioritisation on | suggested re-reading day | |||
| started reading on | finished reading on |
Flashcard 1641189870860
| status | not learned | measured difficulty | 37% [default] | last interval [days] | |||
|---|---|---|---|---|---|---|---|
| repetition number in this series | 0 | memorised on | scheduled repetition | ||||
| scheduled repetition interval | last repetition or drill |
Flashcard 1641191705868
| status | not learned | measured difficulty | 37% [default] | last interval [days] | |||
|---|---|---|---|---|---|---|---|
| repetition number in this series | 0 | memorised on | scheduled repetition | ||||
| scheduled repetition interval | last repetition or drill |
Flashcard 1641193540876
| status | not learned | measured difficulty | 37% [default] | last interval [days] | |||
|---|---|---|---|---|---|---|---|
| repetition number in this series | 0 | memorised on | scheduled repetition | ||||
| scheduled repetition interval | last repetition or drill |
Flashcard 1641195375884
| status | not learned | measured difficulty | 37% [default] | last interval [days] | |||
|---|---|---|---|---|---|---|---|
| repetition number in this series | 0 | memorised on | scheduled repetition | ||||
| scheduled repetition interval | last repetition or drill |
Flashcard 1641197210892
| status | not learned | measured difficulty | 37% [default] | last interval [days] | |||
|---|---|---|---|---|---|---|---|
| repetition number in this series | 0 | memorised on | scheduled repetition | ||||
| scheduled repetition interval | last repetition or drill |
Flashcard 1641199045900
| status | not learned | measured difficulty | 37% [default] | last interval [days] | |||
|---|---|---|---|---|---|---|---|
| repetition number in this series | 0 | memorised on | scheduled repetition | ||||
| scheduled repetition interval | last repetition or drill |
Flashcard 1641200880908
| status | not learned | measured difficulty | 37% [default] | last interval [days] | |||
|---|---|---|---|---|---|---|---|
| repetition number in this series | 0 | memorised on | scheduled repetition | ||||
| scheduled repetition interval | last repetition or drill |
Flashcard 1641202715916
| status | not learned | measured difficulty | 37% [default] | last interval [days] | |||
|---|---|---|---|---|---|---|---|
| repetition number in this series | 0 | memorised on | scheduled repetition | ||||
| scheduled repetition interval | last repetition or drill |
Flashcard 1641204550924
| status | not learned | measured difficulty | 37% [default] | last interval [days] | |||
|---|---|---|---|---|---|---|---|
| repetition number in this series | 0 | memorised on | scheduled repetition | ||||
| scheduled repetition interval | last repetition or drill |
Flashcard 1641206385932
| status | not learned | measured difficulty | 37% [default] | last interval [days] | |||
|---|---|---|---|---|---|---|---|
| repetition number in this series | 0 | memorised on | scheduled repetition | ||||
| scheduled repetition interval | last repetition or drill |
Flashcard 1641208220940
| status | not learned | measured difficulty | 37% [default] | last interval [days] | |||
|---|---|---|---|---|---|---|---|
| repetition number in this series | 0 | memorised on | scheduled repetition | ||||
| scheduled repetition interval | last repetition or drill |
| status | not read | reprioritisations | ||
|---|---|---|---|---|
| last reprioritisation on | suggested re-reading day | |||
| started reading on | finished reading on |
| status | not read | reprioritisations | ||
|---|---|---|---|---|
| last reprioritisation on | suggested re-reading day | |||
| started reading on | finished reading on |
| status | not read | reprioritisations | ||
|---|---|---|---|---|
| last reprioritisation on | suggested re-reading day | |||
| started reading on | finished reading on |
| status | not read | reprioritisations | ||
|---|---|---|---|---|
| last reprioritisation on | suggested re-reading day | |||
| started reading on | finished reading on |
| status | not read | reprioritisations | ||
|---|---|---|---|---|
| last reprioritisation on | suggested re-reading day | |||
| started reading on | finished reading on |
Flashcard 1644299422988
| status | not learned | measured difficulty | 37% [default] | last interval [days] | |||
|---|---|---|---|---|---|---|---|
| repetition number in this series | 0 | memorised on | scheduled repetition | ||||
| scheduled repetition interval | last repetition or drill |
Flashcard 1644301257996
| status | not learned | measured difficulty | 37% [default] | last interval [days] | |||
|---|---|---|---|---|---|---|---|
| repetition number in this series | 0 | memorised on | scheduled repetition | ||||
| scheduled repetition interval | last repetition or drill |
Flashcard 1644303093004
| status | not learned | measured difficulty | 37% [default] | last interval [days] | |||
|---|---|---|---|---|---|---|---|
| repetition number in this series | 0 | memorised on | scheduled repetition | ||||
| scheduled repetition interval | last repetition or drill |
Flashcard 1644304928012
| status | not learned | measured difficulty | 37% [default] | last interval [days] | |||
|---|---|---|---|---|---|---|---|
| repetition number in this series | 0 | memorised on | scheduled repetition | ||||
| scheduled repetition interval | last repetition or drill |
Flashcard 1644306763020
| status | not learned | measured difficulty | 37% [default] | last interval [days] | |||
|---|---|---|---|---|---|---|---|
| repetition number in this series | 0 | memorised on | scheduled repetition | ||||
| scheduled repetition interval | last repetition or drill |
Flashcard 1644308598028
| status | not learned | measured difficulty | 37% [default] | last interval [days] | |||
|---|---|---|---|---|---|---|---|
| repetition number in this series | 0 | memorised on | scheduled repetition | ||||
| scheduled repetition interval | last repetition or drill |
Flashcard 1644310695180
| status | not learned | measured difficulty | 37% [default] | last interval [days] | |||
|---|---|---|---|---|---|---|---|
| repetition number in this series | 0 | memorised on | scheduled repetition | ||||
| scheduled repetition interval | last repetition or drill |
Flashcard 1644312005900
| status | not learned | measured difficulty | 37% [default] | last interval [days] | |||
|---|---|---|---|---|---|---|---|
| repetition number in this series | 0 | memorised on | scheduled repetition | ||||
| scheduled repetition interval | last repetition or drill |
Flashcard 1644315413772
| status | not learned | measured difficulty | 37% [default] | last interval [days] | |||
|---|---|---|---|---|---|---|---|
| repetition number in this series | 0 | memorised on | scheduled repetition | ||||
| scheduled repetition interval | last repetition or drill |
Flashcard 1644317248780
| status | not learned | measured difficulty | 37% [default] | last interval [days] | |||
|---|---|---|---|---|---|---|---|
| repetition number in this series | 0 | memorised on | scheduled repetition | ||||
| scheduled repetition interval | last repetition or drill |
Flashcard 1644319083788
| status | not learned | measured difficulty | 37% [default] | last interval [days] | |||
|---|---|---|---|---|---|---|---|
| repetition number in this series | 0 | memorised on | scheduled repetition | ||||
| scheduled repetition interval | last repetition or drill |
| status | not read | reprioritisations | ||
|---|---|---|---|---|
| last reprioritisation on | suggested re-reading day | |||
| started reading on | finished reading on |
Flashcard 1644322753804
| status | not learned | measured difficulty | 37% [default] | last interval [days] | |||
|---|---|---|---|---|---|---|---|
| repetition number in this series | 0 | memorised on | scheduled repetition | ||||
| scheduled repetition interval | last repetition or drill |
Interquartile Range
Another distance measure of dispersion that we may encounter, the interquartile range, focuses on the middle rather than the extremes. The interquartile range (IQR) is the difference between the third and first quartiles o
Flashcard 1644325113100
| status | not learned | measured difficulty | 37% [default] | last interval [days] | |||
|---|---|---|---|---|---|---|---|
| repetition number in this series | 0 | memorised on | scheduled repetition | ||||
| scheduled repetition interval | last repetition or drill |
Interquartile Range
Another distance measure of dispersion that we may encounter, the interquartile range, focuses on the middle rather than the extremes. The interquartile range (IQR) is the difference between the third and first quartiles of a data set: IQR = Q 3 − Q 1 . The IQR represents the length of the interval containing the mi
Flashcard 1644327472396
| status | not learned | measured difficulty | 37% [default] | last interval [days] | |||
|---|---|---|---|---|---|---|---|
| repetition number in this series | 0 | memorised on | scheduled repetition | ||||
| scheduled repetition interval | last repetition or drill |
Interquartile Range
Another distance measure of dispersion that we may encounter, the interquartile range, focuses on the middle rather than the extremes. The interquartile range (IQR) is the difference between the third and first quartiles of a data set: IQR = Q 3 − Q 1 . The IQR represents the length of the interval containing the middle 50 percent of the data, with a larger interquartile range indicating greater dispersion, all else
Flashcard 1644329831692
| status | not learned | measured difficulty | 37% [default] | last interval [days] | |||
|---|---|---|---|---|---|---|---|
| repetition number in this series | 0 | memorised on | scheduled repetition | ||||
| scheduled repetition interval | last repetition or drill |
Interquartile Range
span>Another distance measure of dispersion that we may encounter, the interquartile range, focuses on the middle rather than the extremes. The interquartile range (IQR) is the difference between the third and first quartiles of a data set: <span>IQR = Q 3 − Q 1 . The IQR represents the length of the interval containing the middle 50 percent of the data, with a larger interquartile range indicating greater dispersion, all else equal.</sp
Flashcard 1644332190988
| status | not learned | measured difficulty | 37% [default] | last interval [days] | |||
|---|---|---|---|---|---|---|---|
| repetition number in this series | 0 | memorised on | scheduled repetition | ||||
| scheduled repetition interval | last repetition or drill |
Interquartile Range
ce measure of dispersion that we may encounter, the interquartile range, focuses on the middle rather than the extremes. The interquartile range (IQR) is the difference between the third and first quartiles of a data set: IQR = Q 3 − Q 1 . <span>The IQR represents the length of the interval containing the middle 50 percent of the data, with a larger interquartile range indicating greater dispersion, all else equal.<span><body><html>
Flashcard 1644334550284
| status | not learned | measured difficulty | 37% [default] | last interval [days] | |||
|---|---|---|---|---|---|---|---|
| repetition number in this series | 0 | memorised on | scheduled repetition | ||||
| scheduled repetition interval | last repetition or drill |
Interquartile Range
le rather than the extremes. The interquartile range (IQR) is the difference between the third and first quartiles of a data set: IQR = Q 3 − Q 1 . The IQR represents the length of the interval containing the middle 50 percent of the data, <span>with a larger interquartile range indicating greater dispersion, all else equal.<span><body><html>
Flashcard 1644336909580
| status | not learned | measured difficulty | 37% [default] | last interval [days] | |||
|---|---|---|---|---|---|---|---|
| repetition number in this series | 0 | memorised on | scheduled repetition | ||||
| scheduled repetition interval | last repetition or drill |
Flashcard 1644338744588
| status | not learned | measured difficulty | 37% [default] | last interval [days] | |||
|---|---|---|---|---|---|---|---|
| repetition number in this series | 0 | memorised on | scheduled repetition | ||||
| scheduled repetition interval | last repetition or drill |
Flashcard 1644340579596
| status | not learned | measured difficulty | 37% [default] | last interval [days] | |||
|---|---|---|---|---|---|---|---|
| repetition number in this series | 0 | memorised on | scheduled repetition | ||||
| scheduled repetition interval | last repetition or drill |
Article 1644342676748
Subject 6. Measures of Dispersion
#has-images #reading-8-statistical-concepts-and-market-returns
Dispersion is defined as "variability around the central tendency." Investment is all about reward versus variability (risk). A central tendency is a measure of the reward of an investment and dispersion is a measure of investment risk. There are two types of dispersions: Absolute dispersion is the amount of variability without comparison to any benchmark. Measures of absolute dispersion include range, mean absolute deviation, variance, and standard deviation. Relative dispersion is the amount of variability in comparison to a benchmark. Measures of relative dispersion include the coefficient of variance. The range is the simplest measure of spread or dispersion. It is equal to the difference between the largest and the smallest values. The range can be a useful measure of spread because it is so easily understood. However, it is very sensitive to extreme scores because it is based on only two values. It also cannot reveal the shape of the distribution. The range should almost never be u
Flashcard 1644351851788
| status | not learned | measured difficulty | 37% [default] | last interval [days] | |||
|---|---|---|---|---|---|---|---|
| repetition number in this series | 0 | memorised on | scheduled repetition | ||||
| scheduled repetition interval | last repetition or drill |
Subject 6. Measures of Dispersion
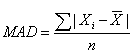
artile range. Example The range of the numbers 1, 2, 4, 6,12,15,19, 26 = 26 - 1 = 25 Recall that the deviation from the arithmetic mean is the distance between the mean and an observation in the data set. <span>The mean absolute deviation (MAD) is the arithmetic average of the absolute deviations around the mean. In calculating the MAD, we ignore the signs of deviations around the mean. Remember that the sum of all the deviations from the mean is equal to
artile range. Example The range of the numbers 1, 2, 4, 6,12,15,19, 26 = 26 - 1 = 25 Recall that the deviation from the arithmetic mean is the distance between the mean and an observation in the data set. <span>The mean absolute deviation (MAD) is the arithmetic average of the absolute deviations around the mean. In calculating the MAD, we ignore the signs of deviations around the mean. Remember that the sum of all the deviations from the mean is equal to
Flashcard 1644353424652
| status | not learned | measured difficulty | 37% [default] | last interval [days] | |||
|---|---|---|---|---|---|---|---|
| repetition number in this series | 0 | memorised on | scheduled repetition | ||||
| scheduled repetition interval | last repetition or drill |
Subject 6. Measures of Dispersion
artile range. Example The range of the numbers 1, 2, 4, 6,12,15,19, 26 = 26 - 1 = 25 Recall that the deviation from the arithmetic mean is the distance between the mean and an observation in the data set. <span>The mean absolute deviation (MAD) is the arithmetic average of the absolute deviations around the mean. In calculating the MAD, we ignore the signs of deviations around the mean. Remember that the sum of all the deviations from the mean is equal to
artile range. Example The range of the numbers 1, 2, 4, 6,12,15,19, 26 = 26 - 1 = 25 Recall that the deviation from the arithmetic mean is the distance between the mean and an observation in the data set. <span>The mean absolute deviation (MAD) is the arithmetic average of the absolute deviations around the mean. In calculating the MAD, we ignore the signs of deviations around the mean. Remember that the sum of all the deviations from the mean is equal to
Flashcard 1644356046092
| status | not learned | measured difficulty | 37% [default] | last interval [days] | |||
|---|---|---|---|---|---|---|---|
| repetition number in this series | 0 | memorised on | scheduled repetition | ||||
| scheduled repetition interval | last repetition or drill |
Flashcard 1644357881100
| status | not learned | measured difficulty | 37% [default] | last interval [days] | |||
|---|---|---|---|---|---|---|---|
| repetition number in this series | 0 | memorised on | scheduled repetition | ||||
| scheduled repetition interval | last repetition or drill |
| status | not read | reprioritisations | ||
|---|---|---|---|---|
| last reprioritisation on | suggested re-reading day | |||
| started reading on | finished reading on |
Flashcard 1644362075404
| status | not learned | measured difficulty | 37% [default] | last interval [days] | |||
|---|---|---|---|---|---|---|---|
| repetition number in this series | 0 | memorised on | scheduled repetition | ||||
| scheduled repetition interval | last repetition or drill |
Flashcard 1644363910412
| status | not learned | measured difficulty | 37% [default] | last interval [days] | |||
|---|---|---|---|---|---|---|---|
| repetition number in this series | 0 | memorised on | scheduled repetition | ||||
| scheduled repetition interval | last repetition or drill |
Flashcard 1644366007564
| status | not learned | measured difficulty | 37% [default] | last interval [days] | |||
|---|---|---|---|---|---|---|---|
| repetition number in this series | 0 | memorised on | scheduled repetition | ||||
| scheduled repetition interval | last repetition or drill |
Flashcard 1644367842572
| status | not learned | measured difficulty | 37% [default] | last interval [days] | |||
|---|---|---|---|---|---|---|---|
| repetition number in this series | 0 | memorised on | scheduled repetition | ||||
| scheduled repetition interval | last repetition or drill |
Flashcard 1644369677580
| status | not learned | measured difficulty | 37% [default] | last interval [days] | |||
|---|---|---|---|---|---|---|---|
| repetition number in this series | 0 | memorised on | scheduled repetition | ||||
| scheduled repetition interval | last repetition or drill |
Flashcard 1644371512588
| status | not learned | measured difficulty | 37% [default] | last interval [days] | |||
|---|---|---|---|---|---|---|---|
| repetition number in this series | 0 | memorised on | scheduled repetition | ||||
| scheduled repetition interval | last repetition or drill |
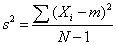
Subject 6. Measures of Dispersion
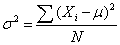
ons in the sample. However, the absolute value is difficult to work with mathematically. The variance is a measure of how spread out a distribution is. It is computed as the average squared deviation of each number from its mean. <span>The formula for the variance in a population is where: μ = the mean N = the number of scores When the variance is computed in a sample, the statistic(m = the mean of the sample) can be used
ons in the sample. However, the absolute value is difficult to work with mathematically. The variance is a measure of how spread out a distribution is. It is computed as the average squared deviation of each number from its mean. <span>The formula for the variance in a population is where: μ = the mean N = the number of scores When the variance is computed in a sample, the statistic(m = the mean of the sample) can be used
Flashcard 1644373871884
| status | not learned | measured difficulty | 37% [default] | last interval [days] | |||
|---|---|---|---|---|---|---|---|
| repetition number in this series | 0 | memorised on | scheduled repetition | ||||
| scheduled repetition interval | last repetition or drill |
Flashcard 1644375706892
| status | not learned | measured difficulty | 37% [default] | last interval [days] | |||
|---|---|---|---|---|---|---|---|
| repetition number in this series | 0 | memorised on | scheduled repetition | ||||
| scheduled repetition interval | last repetition or drill |
Flashcard 1644377541900
| status | not learned | measured difficulty | 37% [default] | last interval [days] | |||
|---|---|---|---|---|---|---|---|
| repetition number in this series | 0 | memorised on | scheduled repetition | ||||
| scheduled repetition interval | last repetition or drill |
Subject 6. Measures of Dispersion
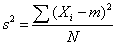
read out a distribution is. It is computed as the average squared deviation of each number from its mean. The formula for the variance in a population is where: μ = the mean N = the number of scores <span>When the variance is computed in a sample, the statistic(m = the mean of the sample) can be used. However, s 2 is a biased estimate of σ 2 . By far the most common formula for computing variance in a sample is: 
read out a distribution is. It is computed as the average squared deviation of each number from its mean. The formula for the variance in a population is where: μ = the mean N = the number of scores <span>When the variance is computed in a sample, the statistic(m = the mean of the sample) can be used. However, s 2 is a biased estimate of σ 2 . By far the most common formula for computing variance in a sample is: 
| status | not read | reprioritisations | ||
|---|---|---|---|---|
| last reprioritisation on | suggested re-reading day | |||
| started reading on | finished reading on |
| status | not read | reprioritisations | ||
|---|---|---|---|---|
| last reprioritisation on | suggested re-reading day | |||
| started reading on | finished reading on |
Flashcard 1644383833356
| status | not learned | measured difficulty | 37% [default] | last interval [days] | |||
|---|---|---|---|---|---|---|---|
| repetition number in this series | 0 | memorised on | scheduled repetition | ||||
| scheduled repetition interval | last repetition or drill |
Flashcard 1644386454796
| status | not learned | measured difficulty | 37% [default] | last interval [days] | |||
|---|---|---|---|---|---|---|---|
| repetition number in this series | 0 | memorised on | scheduled repetition | ||||
| scheduled repetition interval | last repetition or drill |
Subject 6. Measures of Dispersion
n is where: μ = the mean N = the number of scores When the variance is computed in a sample, the statistic(m = the mean of the sample) can be used. However, s 2 is a biased estimate of σ 2 . By far <span>the most common formula for computing variance in a sample is: This gives an unbiased estimate of σ 2 . Since samples are usually used to estimate parameters, s 2 is the most commonly used measure of variance
n is where: μ = the mean N = the number of scores When the variance is computed in a sample, the statistic(m = the mean of the sample) can be used. However, s 2 is a biased estimate of σ 2 . By far <span>the most common formula for computing variance in a sample is: This gives an unbiased estimate of σ 2 . Since samples are usually used to estimate parameters, s 2 is the most commonly used measure of variance
| status | not read | reprioritisations | ||
|---|---|---|---|---|
| last reprioritisation on | suggested re-reading day | |||
| started reading on | finished reading on |
Subject 6. Measures of Dispersion
tion variance except for the use of the sample mean, X, and the denominator. In the case of the population variance, we divide by the size of the population, N. For the sample variance, however, we divide by the sample size minus 1, or N - 1. <span>In the math of statistics, using only N in the denominator when using a sample to represent its population will result in underestimating the population variance, especially for small sample sizes. This systematic understatement causes the sample variance to be a biased estimator of the population variance. By using (N - 1) instead of N in the denominator, we compensate for this underestimation. Thus, using N - 1, the sample variance (s 2 ) will be an unbiased estimator of the population variance (σ 2 ). The major problem with using the variance is the difficulty interpreting it. Why? The variance, unlike the mean, is in terms of units squared. How does one interpret square
Flashcard 1644390386956
| status | not learned | measured difficulty | 37% [default] | last interval [days] | |||
|---|---|---|---|---|---|---|---|
| repetition number in this series | 0 | memorised on | scheduled repetition | ||||
| scheduled repetition interval | last repetition or drill |
Flashcard 1644392221964
| status | not learned | measured difficulty | 37% [default] | last interval [days] | |||
|---|---|---|---|---|---|---|---|
| repetition number in this series | 0 | memorised on | scheduled repetition | ||||
| scheduled repetition interval | last repetition or drill |
Flashcard 1644394056972
| status | not learned | measured difficulty | 37% [default] | last interval [days] | |||
|---|---|---|---|---|---|---|---|
| repetition number in this series | 0 | memorised on | scheduled repetition | ||||
| scheduled repetition interval | last repetition or drill |
Flashcard 1644395891980
| status | not learned | measured difficulty | 37% [default] | last interval [days] | |||
|---|---|---|---|---|---|---|---|
| repetition number in this series | 0 | memorised on | scheduled repetition | ||||
| scheduled repetition interval | last repetition or drill |
Flashcard 1644397726988
| status | not learned | measured difficulty | 37% [default] | last interval [days] | |||
|---|---|---|---|---|---|---|---|
| repetition number in this series | 0 | memorised on | scheduled repetition | ||||
| scheduled repetition interval | last repetition or drill |
Flashcard 1644399037708
| status | not learned | measured difficulty | 37% [default] | last interval [days] | |||
|---|---|---|---|---|---|---|---|
| repetition number in this series | 0 | memorised on | scheduled repetition | ||||
| scheduled repetition interval | last repetition or drill |
| status | not read | reprioritisations | ||
|---|---|---|---|---|
| last reprioritisation on | suggested re-reading day | |||
| started reading on | finished reading on |
| status | not read | reprioritisations | ||
|---|---|---|---|---|
| last reprioritisation on | suggested re-reading day | |||
| started reading on | finished reading on |
Flashcard 1644406639884
| status | not learned | measured difficulty | 37% [default] | last interval [days] | |||
|---|---|---|---|---|---|---|---|
| repetition number in this series | 0 | memorised on | scheduled repetition | ||||
| scheduled repetition interval | last repetition or drill |
Flashcard 1644408474892
| status | not learned | measured difficulty | 37% [default] | last interval [days] | |||
|---|---|---|---|---|---|---|---|
| repetition number in this series | 0 | memorised on | scheduled repetition | ||||
| scheduled repetition interval | last repetition or drill |
Flashcard 1644410309900
| status | not learned | measured difficulty | 37% [default] | last interval [days] | |||
|---|---|---|---|---|---|---|---|
| repetition number in this series | 0 | memorised on | scheduled repetition | ||||
| scheduled repetition interval | last repetition or drill |
Flashcard 1644412144908
| status | not learned | measured difficulty | 37% [default] | last interval [days] | |||
|---|---|---|---|---|---|---|---|
| repetition number in this series | 0 | memorised on | scheduled repetition | ||||
| scheduled repetition interval | last repetition or drill |
| status | not read | reprioritisations | ||
|---|---|---|---|---|
| last reprioritisation on | suggested re-reading day | |||
| started reading on | finished reading on |
Subject 6. Measures of Dispersion
variance indicates the adequacy of the mean as representative of the population by measuring the deviation from expectation. Basically, the variance and the standard deviation are measures of the average deviation from the mean. <span>An important attribute of the standard deviation as a measure of spread is that if the mean and standard deviation of a normal distribution are known, it is possible to compute the percentile rank associated with any given score. In a normal distribution, about 68% of the scores are within one standard deviation of the mean and about 95% of the scores are within two standards deviations of the mean.
| status | not read | reprioritisations | ||
|---|---|---|---|---|
| last reprioritisation on | suggested re-reading day | |||
| started reading on | finished reading on |
Subject 6. Measures of Dispersion
An important attribute of the standard deviation as a measure of spread is that if the mean and standard deviation of a normal distribution are known, it is possible to compute the percentile rank associated with any given score. <span>In a normal distribution, about 68% of the scores are within one standard deviation of the mean and about 95% of the scores are within two standards deviations of the mean. The standard deviation has proven to be an extremely useful measure of spread in part because it is mathematically tractable. Many formulas in inferential statistics use th
Flashcard 1644417125644
| status | not learned | measured difficulty | 37% [default] | last interval [days] | |||
|---|---|---|---|---|---|---|---|
| repetition number in this series | 0 | memorised on | scheduled repetition | ||||
| scheduled repetition interval | last repetition or drill |
| status | not read | reprioritisations | ||
|---|---|---|---|---|
| last reprioritisation on | suggested re-reading day | |||
| started reading on | finished reading on |
| status | not read | reprioritisations | ||
|---|---|---|---|---|
| last reprioritisation on | suggested re-reading day | |||
| started reading on | finished reading on |
Flashcard 1644423417100
| status | not learned | measured difficulty | 37% [default] | last interval [days] | |||
|---|---|---|---|---|---|---|---|
| repetition number in this series | 0 | memorised on | scheduled repetition | ||||
| scheduled repetition interval | last repetition or drill |
Flashcard 1644425252108
| status | not learned | measured difficulty | 37% [default] | last interval [days] | |||
|---|---|---|---|---|---|---|---|
| repetition number in this series | 0 | memorised on | scheduled repetition | ||||
| scheduled repetition interval | last repetition or drill |
Flashcard 1644427087116
| status | not learned | measured difficulty | 37% [default] | last interval [days] | |||
|---|---|---|---|---|---|---|---|
| repetition number in this series | 0 | memorised on | scheduled repetition | ||||
| scheduled repetition interval | last repetition or drill |
Flashcard 1644428922124
| status | not learned | measured difficulty | 37% [default] | last interval [days] | |||
|---|---|---|---|---|---|---|---|
| repetition number in this series | 0 | memorised on | scheduled repetition | ||||
| scheduled repetition interval | last repetition or drill |
Flashcard 1644430757132
| status | not learned | measured difficulty | 37% [default] | last interval [days] | |||
|---|---|---|---|---|---|---|---|
| repetition number in this series | 0 | memorised on | scheduled repetition | ||||
| scheduled repetition interval | last repetition or drill |
Flashcard 1644432592140
| status | not learned | measured difficulty | 37% [default] | last interval [days] | |||
|---|---|---|---|---|---|---|---|
| repetition number in this series | 0 | memorised on | scheduled repetition | ||||
| scheduled repetition interval | last repetition or drill |
Flashcard 1644434427148
| status | not learned | measured difficulty | 37% [default] | last interval [days] | |||
|---|---|---|---|---|---|---|---|
| repetition number in this series | 0 | memorised on | scheduled repetition | ||||
| scheduled repetition interval | last repetition or drill |
| status | not read | reprioritisations | ||
|---|---|---|---|---|
| last reprioritisation on | suggested re-reading day | |||
| started reading on | finished reading on |
Flashcard 1644438097164
| status | not learned | measured difficulty | 37% [default] | last interval [days] | |||
|---|---|---|---|---|---|---|---|
| repetition number in this series | 0 | memorised on | scheduled repetition | ||||
| scheduled repetition interval | last repetition or drill |
Flashcard 1644439932172
| status | not learned | measured difficulty | 37% [default] | last interval [days] | |||
|---|---|---|---|---|---|---|---|
| repetition number in this series | 0 | memorised on | scheduled repetition | ||||
| scheduled repetition interval | last repetition or drill |
| status | not read | reprioritisations | ||
|---|---|---|---|---|
| last reprioritisation on | suggested re-reading day | |||
| started reading on | finished reading on |
Flashcard 1644444388620
| status | not learned | measured difficulty | 37% [default] | last interval [days] | |||
|---|---|---|---|---|---|---|---|
| repetition number in this series | 0 | memorised on | scheduled repetition | ||||
| scheduled repetition interval | last repetition or drill |
| status | not read | reprioritisations | ||
|---|---|---|---|---|
| last reprioritisation on | suggested re-reading day | |||
| started reading on | finished reading on |
Flashcard 1644448058636
| status | not learned | measured difficulty | 37% [default] | last interval [days] | |||
|---|---|---|---|---|---|---|---|
| repetition number in this series | 0 | memorised on | scheduled repetition | ||||
| scheduled repetition interval | last repetition or drill |
Flashcard 1644449893644
| status | not learned | measured difficulty | 37% [default] | last interval [days] | |||
|---|---|---|---|---|---|---|---|
| repetition number in this series | 0 | memorised on | scheduled repetition | ||||
| scheduled repetition interval | last repetition or drill |
| status | not read | reprioritisations | ||
|---|---|---|---|---|
| last reprioritisation on | suggested re-reading day | |||
| started reading on | finished reading on |
Flashcard 1644453563660
| status | not learned | measured difficulty | 37% [default] | last interval [days] | |||
|---|---|---|---|---|---|---|---|
| repetition number in this series | 0 | memorised on | scheduled repetition | ||||
| scheduled repetition interval | last repetition or drill |
Flashcard 1644455398668
| status | not learned | measured difficulty | 37% [default] | last interval [days] | |||
|---|---|---|---|---|---|---|---|
| repetition number in this series | 0 | memorised on | scheduled repetition | ||||
| scheduled repetition interval | last repetition or drill |
Flashcard 1644457233676
| status | not learned | measured difficulty | 37% [default] | last interval [days] | |||
|---|---|---|---|---|---|---|---|
| repetition number in this series | 0 | memorised on | scheduled repetition | ||||
| scheduled repetition interval | last repetition or drill |
Flashcard 1644459068684
| status | not learned | measured difficulty | 37% [default] | last interval [days] | |||
|---|---|---|---|---|---|---|---|
| repetition number in this series | 0 | memorised on | scheduled repetition | ||||
| scheduled repetition interval | last repetition or drill |
Flashcard 1644460903692
| status | not learned | measured difficulty | 37% [default] | last interval [days] | |||
|---|---|---|---|---|---|---|---|
| repetition number in this series | 0 | memorised on | scheduled repetition | ||||
| scheduled repetition interval | last repetition or drill |
| status | not read | reprioritisations | ||
|---|---|---|---|---|
| last reprioritisation on | suggested re-reading day | |||
| started reading on | finished reading on |
Flashcard 1644464573708
| status | not learned | measured difficulty | 37% [default] | last interval [days] | |||
|---|---|---|---|---|---|---|---|
| repetition number in this series | 0 | memorised on | scheduled repetition | ||||
| scheduled repetition interval | last repetition or drill |
Flashcard 1644466408716
| status | not learned | measured difficulty | 37% [default] | last interval [days] | |||
|---|---|---|---|---|---|---|---|
| repetition number in this series | 0 | memorised on | scheduled repetition | ||||
| scheduled repetition interval | last repetition or drill |
| status | not read | reprioritisations | ||
|---|---|---|---|---|
| last reprioritisation on | suggested re-reading day | |||
| started reading on | finished reading on |
| status | not read | reprioritisations | ||
|---|---|---|---|---|
| last reprioritisation on | suggested re-reading day | |||
| started reading on | finished reading on |
Flashcard 1644474273036
| status | not learned | measured difficulty | 37% [default] | last interval [days] | |||
|---|---|---|---|---|---|---|---|
| repetition number in this series | 0 | memorised on | scheduled repetition | ||||
| scheduled repetition interval | last repetition or drill |
| status | not read | reprioritisations | ||
|---|---|---|---|---|
| last reprioritisation on | suggested re-reading day | |||
| started reading on | finished reading on |
| status | not read | reprioritisations | ||
|---|---|---|---|---|
| last reprioritisation on | suggested re-reading day | |||
| started reading on | finished reading on |
Flashcard 1644479778060
| status | not learned | measured difficulty | 37% [default] | last interval [days] | |||
|---|---|---|---|---|---|---|---|
| repetition number in this series | 0 | memorised on | scheduled repetition | ||||
| scheduled repetition interval | last repetition or drill |
Flashcard 1644482399500
| status | not learned | measured difficulty | 37% [default] | last interval [days] | |||
|---|---|---|---|---|---|---|---|
| repetition number in this series | 0 | memorised on | scheduled repetition | ||||
| scheduled repetition interval | last repetition or drill |
Flashcard 1644484234508
| status | not learned | measured difficulty | 37% [default] | last interval [days] | |||
|---|---|---|---|---|---|---|---|
| repetition number in this series | 0 | memorised on | scheduled repetition | ||||
| scheduled repetition interval | last repetition or drill |
Flashcard 1644486069516
| status | not learned | measured difficulty | 37% [default] | last interval [days] | |||
|---|---|---|---|---|---|---|---|
| repetition number in this series | 0 | memorised on | scheduled repetition | ||||
| scheduled repetition interval | last repetition or drill |
Flashcard 1644487904524
| status | not learned | measured difficulty | 37% [default] | last interval [days] | |||
|---|---|---|---|---|---|---|---|
| repetition number in this series | 0 | memorised on | scheduled repetition | ||||
| scheduled repetition interval | last repetition or drill |
Flashcard 1644489739532
| status | not learned | measured difficulty | 37% [default] | last interval [days] | |||
|---|---|---|---|---|---|---|---|
| repetition number in this series | 0 | memorised on | scheduled repetition | ||||
| scheduled repetition interval | last repetition or drill |
Flashcard 1644491574540
| status | not learned | measured difficulty | 37% [default] | last interval [days] | |||
|---|---|---|---|---|---|---|---|
| repetition number in this series | 0 | memorised on | scheduled repetition | ||||
| scheduled repetition interval | last repetition or drill |
Flashcard 1644493409548
| status | not learned | measured difficulty | 37% [default] | last interval [days] | |||
|---|---|---|---|---|---|---|---|
| repetition number in this series | 0 | memorised on | scheduled repetition | ||||
| scheduled repetition interval | last repetition or drill |
Flashcard 1644495244556
| status | not learned | measured difficulty | 37% [default] | last interval [days] | |||
|---|---|---|---|---|---|---|---|
| repetition number in this series | 0 | memorised on | scheduled repetition | ||||
| scheduled repetition interval | last repetition or drill |
| status | not read | reprioritisations | ||
|---|---|---|---|---|
| last reprioritisation on | suggested re-reading day | |||
| started reading on | finished reading on |
Flashcard 1644498914572
| status | not learned | measured difficulty | 37% [default] | last interval [days] | |||
|---|---|---|---|---|---|---|---|
| repetition number in this series | 0 | memorised on | scheduled repetition | ||||
| scheduled repetition interval | last repetition or drill |
Flashcard 1644500749580
| status | not learned | measured difficulty | 37% [default] | last interval [days] | |||
|---|---|---|---|---|---|---|---|
| repetition number in this series | 0 | memorised on | scheduled repetition | ||||
| scheduled repetition interval | last repetition or drill |
Flashcard 1644502584588
| status | not learned | measured difficulty | 37% [default] | last interval [days] | |||
|---|---|---|---|---|---|---|---|
| repetition number in this series | 0 | memorised on | scheduled repetition | ||||
| scheduled repetition interval | last repetition or drill |
| status | not read | reprioritisations | ||
|---|---|---|---|---|
| last reprioritisation on | suggested re-reading day | |||
| started reading on | finished reading on |
Flashcard 1644506254604
| status | not learned | measured difficulty | 37% [default] | last interval [days] | |||
|---|---|---|---|---|---|---|---|
| repetition number in this series | 0 | memorised on | scheduled repetition | ||||
| scheduled repetition interval | last repetition or drill |
Flashcard 1644508089612
| status | not learned | measured difficulty | 37% [default] | last interval [days] | |||
|---|---|---|---|---|---|---|---|
| repetition number in this series | 0 | memorised on | scheduled repetition | ||||
| scheduled repetition interval | last repetition or drill |
Flashcard 1644509924620
| status | not learned | measured difficulty | 37% [default] | last interval [days] | |||
|---|---|---|---|---|---|---|---|
| repetition number in this series | 0 | memorised on | scheduled repetition | ||||
| scheduled repetition interval | last repetition or drill |
Flashcard 1644511759628
| status | not learned | measured difficulty | 37% [default] | last interval [days] | |||
|---|---|---|---|---|---|---|---|
| repetition number in this series | 0 | memorised on | scheduled repetition | ||||
| scheduled repetition interval | last repetition or drill |
Flashcard 1644513594636
| status | not learned | measured difficulty | 37% [default] | last interval [days] | |||
|---|---|---|---|---|---|---|---|
| repetition number in this series | 0 | memorised on | scheduled repetition | ||||
| scheduled repetition interval | last repetition or drill |
Flashcard 1644515429644
| status | not learned | measured difficulty | 37% [default] | last interval [days] | |||
|---|---|---|---|---|---|---|---|
| repetition number in this series | 0 | memorised on | scheduled repetition | ||||
| scheduled repetition interval | last repetition or drill |
Flashcard 1644517264652
| status | not learned | measured difficulty | 37% [default] | last interval [days] | |||
|---|---|---|---|---|---|---|---|
| repetition number in this series | 0 | memorised on | scheduled repetition | ||||
| scheduled repetition interval | last repetition or drill |
Flashcard 1644519099660
| status | not learned | measured difficulty | 37% [default] | last interval [days] | |||
|---|---|---|---|---|---|---|---|
| repetition number in this series | 0 | memorised on | scheduled repetition | ||||
| scheduled repetition interval | last repetition or drill |
Flashcard 1644523031820
| status | not learned | measured difficulty | 37% [default] | last interval [days] | |||
|---|---|---|---|---|---|---|---|
| repetition number in this series | 0 | memorised on | scheduled repetition | ||||
| scheduled repetition interval | last repetition or drill |
Flashcard 1644524866828
| status | not learned | measured difficulty | 37% [default] | last interval [days] | |||
|---|---|---|---|---|---|---|---|
| repetition number in this series | 0 | memorised on | scheduled repetition | ||||
| scheduled repetition interval | last repetition or drill |
| status | not read | reprioritisations | ||
|---|---|---|---|---|
| last reprioritisation on | suggested re-reading day | |||
| started reading on | finished reading on |
Flashcard 1644545838348
| status | not learned | measured difficulty | 37% [default] | last interval [days] | |||
|---|---|---|---|---|---|---|---|
| repetition number in this series | 0 | memorised on | scheduled repetition | ||||
| scheduled repetition interval | last repetition or drill |
| status | not read | reprioritisations | ||
|---|---|---|---|---|
| last reprioritisation on | suggested re-reading day | |||
| started reading on | finished reading on |
Flashcard 1644550032652
| status | not learned | measured difficulty | 37% [default] | last interval [days] | |||
|---|---|---|---|---|---|---|---|
| repetition number in this series | 0 | memorised on | scheduled repetition | ||||
| scheduled repetition interval | last repetition or drill |
Flashcard 1644551867660
| status | not learned | measured difficulty | 37% [default] | last interval [days] | |||
|---|---|---|---|---|---|---|---|
| repetition number in this series | 0 | memorised on | scheduled repetition | ||||
| scheduled repetition interval | last repetition or drill |
Flashcard 1644553702668
| status | not learned | measured difficulty | 37% [default] | last interval [days] | |||
|---|---|---|---|---|---|---|---|
| repetition number in this series | 0 | memorised on | scheduled repetition | ||||
| scheduled repetition interval | last repetition or drill |
Flashcard 1644555799820
| status | not learned | measured difficulty | 37% [default] | last interval [days] | |||
|---|---|---|---|---|---|---|---|
| repetition number in this series | 0 | memorised on | scheduled repetition | ||||
| scheduled repetition interval | last repetition or drill |
Flashcard 1644557896972
| status | not learned | measured difficulty | 37% [default] | last interval [days] | |||
|---|---|---|---|---|---|---|---|
| repetition number in this series | 0 | memorised on | scheduled repetition | ||||
| scheduled repetition interval | last repetition or drill |
Flashcard 1644560518412
| status | not learned | measured difficulty | 37% [default] | last interval [days] | |||
|---|---|---|---|---|---|---|---|
| repetition number in this series | 0 | memorised on | scheduled repetition | ||||
| scheduled repetition interval | last repetition or drill |
Flashcard 1644562353420
| status | not learned | measured difficulty | 37% [default] | last interval [days] | |||
|---|---|---|---|---|---|---|---|
| repetition number in this series | 0 | memorised on | scheduled repetition | ||||
| scheduled repetition interval | last repetition or drill |
Flashcard 1644564450572
| status | not learned | measured difficulty | 37% [default] | last interval [days] | |||
|---|---|---|---|---|---|---|---|
| repetition number in this series | 0 | memorised on | scheduled repetition | ||||
| scheduled repetition interval | last repetition or drill |
| status | not read | reprioritisations | ||
|---|---|---|---|---|
| last reprioritisation on | suggested re-reading day | |||
| started reading on | finished reading on |
Flashcard 1644568382732
| status | not learned | measured difficulty | 37% [default] | last interval [days] | |||
|---|---|---|---|---|---|---|---|
| repetition number in this series | 0 | memorised on | scheduled repetition | ||||
| scheduled repetition interval | last repetition or drill |
Flashcard 1644570217740
| status | not learned | measured difficulty | 37% [default] | last interval [days] | |||
|---|---|---|---|---|---|---|---|
| repetition number in this series | 0 | memorised on | scheduled repetition | ||||
| scheduled repetition interval | last repetition or drill |
| status | not read | reprioritisations | ||
|---|---|---|---|---|
| last reprioritisation on | suggested re-reading day | |||
| started reading on | finished reading on |
Flashcard 1644574149900
| status | not learned | measured difficulty | 37% [default] | last interval [days] | |||
|---|---|---|---|---|---|---|---|
| repetition number in this series | 0 | memorised on | scheduled repetition | ||||
| scheduled repetition interval | last repetition or drill |
Flashcard 1644576247052
| status | not learned | measured difficulty | 37% [default] | last interval [days] | |||
|---|---|---|---|---|---|---|---|
| repetition number in this series | 0 | memorised on | scheduled repetition | ||||
| scheduled repetition interval | last repetition or drill |
Flashcard 1644577033484
| status | not learned | measured difficulty | 37% [default] | last interval [days] | |||
|---|---|---|---|---|---|---|---|
| repetition number in this series | 0 | memorised on | scheduled repetition | ||||
| scheduled repetition interval | last repetition or drill |
| status | not read | reprioritisations | ||
|---|---|---|---|---|
| last reprioritisation on | suggested re-reading day | |||
| started reading on | finished reading on |
Flashcard 1644583324940
| status | not learned | measured difficulty | 37% [default] | last interval [days] | |||
|---|---|---|---|---|---|---|---|
| repetition number in this series | 0 | memorised on | scheduled repetition | ||||
| scheduled repetition interval | last repetition or drill |
Open it
Note that as n becomes large, the expression reduces to the mean cubed deviation, SK ≈ (1/n) n∑ i=1 (Xi−X) 3 / s 3 . As a frame of reference, for a sample size of 100 or larger taken from a normal distribution, a skewness coefficient of ±0.5 would be considered unusually large.
| status | not read | reprioritisations | ||
|---|---|---|---|---|
| last reprioritisation on | suggested re-reading day | |||
| started reading on | finished reading on |