Edited, memorised or added to reading queue
on 13-Dec-2017 (Wed)
Do you want BuboFlash to help you learning these things? Click here to log in or create user.
Flashcard 1425592421644
| status | not learned | measured difficulty | 37% [default] | last interval [days] | |||
|---|---|---|---|---|---|---|---|
| repetition number in this series | 0 | memorised on | scheduled repetition | ||||
| scheduled repetition interval | last repetition or drill |
Parent (intermediate) annotation
Open itMacroeconomics deals with aggregate economic quantities, such as national output and national income.
Original toplevel document
1. INTRODUCTIONIn a general sense, economics is the study of production, distribution, and consumption and can be divided into two broad areas of study: macroeconomics and microeconomics. Macroeconomics deals with aggregate economic quantities, such as national output and national income. Macroeconomics has its roots in microeconomics , which deals with markets and decision making of individual economic units, including consumers and businesses. Microeconomics is a logi
Flashcard 1426258267404
| status | not learned | measured difficulty | 37% [default] | last interval [days] | |||
|---|---|---|---|---|---|---|---|
| repetition number in this series | 0 | memorised on | scheduled repetition | ||||
| scheduled repetition interval | last repetition or drill |
Parent (intermediate) annotation
Open itIn general, producers are willing to sell their product for a price as long as that price is at least as high as the cost to produce an additional unit of the product.
Original toplevel document
3.3. The Supply Function and the Supply CurveThe willingness and ability to sell a good or service is called supply. In general, producers are willing to sell their product for a price as long as that price is at least as high as the cost to produce an additional unit of the product. It follows that the willingness to supply, called the supply function , depends on the price at which the good can be sold as well as the cost of production for an additional unit of t
Flashcard 1430334082316
| status | not learned | measured difficulty | 37% [default] | last interval [days] | |||
|---|---|---|---|---|---|---|---|
| repetition number in this series | 0 | memorised on | scheduled repetition | ||||
| scheduled repetition interval | last repetition or drill |
Parent (intermediate) annotation
Open itA change in a good’s own-price causes a movement along the demand curve, this is referred to as a change in quantity demanded, A change in the value of any other variable will shift the entire demand curve. This is referred to as a <span>change in demand.<span><body><html>
Original toplevel document
Open itbut the intercepts have both increased, resulting in an outward shift in the demand curve, as shown in Exhibit 2. Exhibit 2. Household Demand Curve for Gasoline before and after Change in Income <span>In general, the only thing that can cause a movement along the demand curve is a change in a good’s own-price. A change in the value of any other variable will shift the entire demand curve. The former is referred to as a change in quantity demanded, and the latter is referred to as a change in demand. More importantly, the shift in demand was both a vertical shift upward and a horizontal shift to the right. That is to say, for any given quantity, the household is now wil
Flashcard 1432888675596
| status | not learned | measured difficulty | 37% [default] | last interval [days] | |||
|---|---|---|---|---|---|---|---|
| repetition number in this series | 0 | memorised on | scheduled repetition | ||||
| scheduled repetition interval | last repetition or drill |
Parent (intermediate) annotation
Open itMéxico debe fortalecer su posición negociadora acercándose a la otra superpotencia comercial: China.
Original toplevel document
Trump y el efecto de “huevo revuelto”rimiendo cómo conseguir aumentar la competitividad de América del Norte, en particular en el contexto de un dólar fortalecido que le ha restado competitividad a su industria. Sin embargo, como le hemos comentado en otras ocasiones, <span>México debe fortalecer su posición negociadora acercándose a la otra superpotencia comercial: China. El arribo de la empresa petrolera china CNOOC, que invertirá cerca de 8 mil millones de dólares en el Golfo de México, multiplicará por 40 veces la inversión china acumulada
Flashcard 1433029709068
| status | not learned | measured difficulty | 37% [default] | last interval [days] | |||
|---|---|---|---|---|---|---|---|
| repetition number in this series | 0 | memorised on | scheduled repetition | ||||
| scheduled repetition interval | last repetition or drill |
Parent (intermediate) annotation
Open itLa mejor contribución que hace la política monetaria al crecimiento económico es mantener la inflación baja, que se traduce en un ambiente de mayor confianza
Original toplevel document
Carstens fue muy importante, pero el Banxico va a seguirmi salida. En ese contexto, puede destacarse en estos años una mayor apertura. Banxico ha publicado una serie de documentos que reflejan una mayor transparencia, en particular las minutas de las reuniones de política monetaria. <span>La mejor contribución que hace la política monetaria al crecimiento económico es mantener la inflación baja, que se traduce en un ambiente de mayor confianza También podemos hacer muy bien nuestro trabajo fortaleciendo la institución o hacerlo muy mal, debilitando la institución Son una pieza de informa
Flashcard 1435564641548
| status | not learned | measured difficulty | 37% [default] | last interval [days] | |||
|---|---|---|---|---|---|---|---|
| repetition number in this series | 0 | memorised on | scheduled repetition | ||||
| scheduled repetition interval | last repetition or drill |
Parent (intermediate) annotation
Open itFinance experts frequently reconcile profitability and risk objectives by stating that the objective of the firm is, or should be, shareholder wealth maximization (i.e., to maximize the market value of shareholders’ equity)
Original toplevel document
2. OBJECTIVES OF THE FIRMen be classified as focused on profitability (e.g., maximizing profits, increasing market share) or on controlling risk (e.g., survival, stable earnings growth); and c) managers in different countries may have different emphases. <span>Finance experts frequently reconcile profitability and risk objectives by stating that the objective of the firm is, or should be, shareholder wealth maximization (i.e., to maximize the market value of shareholders’ equity). This theory states that firms try, or should try, to increase the wealth of their owners (shareholders) and that market prices balance returns against risk. However, complex corporate
Flashcard 1435622837516
| status | not learned | measured difficulty | 37% [default] | last interval [days] | |||
|---|---|---|---|---|---|---|---|
| repetition number in this series | 0 | memorised on | scheduled repetition | ||||
| scheduled repetition interval | last repetition or drill |
Parent (intermediate) annotation
Open itWe can define a term, economic cost , equal to the sum of total accounting costs and implicit opportunity costs.
Original toplevel document
2. OBJECTIVES OF THE FIRM00 – $48,000,000 = $2,000,000. Note that total accounting costs in either case include interest expense—which represents the return required by suppliers of debt capital—because interest expense is an explicit cost. <span>2.1.2. Economic Profit and Normal Profit Economic profit (also known as abnormal profit or supernormal profit ) may be defined broadly as accounting profit less the implicit opportunity costs not included in total accounting costs. Equation (3a) Economic profit = Accounting profit – Total implicit opportunity costs We can define a term, economic cost , equal to the sum of total accounting costs and implicit opportunity costs. Economic profit is therefore equivalently defined as: Equation (3b) Economic profit = Total revenue – Total economic costs For publicly traded corporations, the focus of investment analysts’ work, the cost of equity capital is the largest and most readily identified implicit opportunity cost omitted in calculating total accounting cost. Consequently, economic profit can be defined for publicly traded corporations as accounting profit less the required return on equity capital. Examples will make these concepts clearer. Consider the start-up company for which we calculated an accounting profit of €300,000 and suppose that the entrepreneurial executive who launched the start-up took a salary reduction of €100,000 per year relative to the job he left. That €100,000 is an opportunity cost of involving him in running the start-up. Besides labor, financial capital is a resource. Suppose that the executive, as sole owner, makes an investment of €1,500,000 to launch the enterprise and that he might otherwise expect to earn €200,000 per year on that amount in a similar risk investment. Total implicit opportunity costs are €100,000 + €200,000 = €300,000 per year and economic profit is zero: €300,000 – €300,000 = €0. For the publicly traded corporation, we consider the cost of equity capital as the only implicit opportunity cost identifiable. Suppose that equity investment is $18,750,000 and shareholders’ required rate of return is 8 percent so that the dollar cost of equity capital is $1,500,000. Economic profit for the publicly traded corporation is therefore $2,000,000 (accounting profit) less $1,500,000 (cost of equity capital) or $500,000. For the start-up company, economic profit was zero. Total economic costs were just covered by revenues and the company was not earning a euro more nor less than the amount that meets the opportunity costs of the resources used in the business. Economists would say the company was earning a normal profit (economic profit of zero). In simple terms, normal profit is the level of accounting profit needed to just cover the implicit opportunity costs ignored in accounting costs. For the publicly traded corporation, normal profit was $1,500,000: normal profit can be taken to be the cost of equity capital (in money terms) for such a company or the dollar return required on an equal investment by equity holders in an equivalently risky alternative investment opportunity. The publicly traded corporation actually earned $500,000 in excess of normal profit, which should be reflected in the common shares’ market price. Thus, the following expression links accounting profit to economic profit and normal profit: Equation (4) Accounting profit = Economic profit + Normal profit When accounting profit equals normal profit, economic profit is zero. Further, when accounting profit is greater than normal profit, economic profit is positive; and when accounting profit is less than normal profit, economic profit is negative (the firm has an economic loss ). Economic profit for a firm can originate from sources such as: competitive advantage; exceptional managerial efficiency or skill; difficult to copy technology or innovation (e.g., patents, trademarks, and copyrights); exclusive access to less-expensive inputs; fixed supply of an output, commodity, or resource; preferential treatment under governmental policy; large increases in demand where supply is unable to respond fully over time; exertion of monopoly power (price control) in the market; and market barriers to entry that limit competition. Any of the above factors may lead the firm to have positive net present value investment (NPV) opportunities. Access to positive NPV opportunities and therefore profit in excess of normal profits in the short run may or may not exist in the long run, depending on the potential strength of competition. In highly competitive market situations, firms tend to earn the normal profit level over time because ease of market entry allows for other competing firms to compete away any economic profit over the long run. Economic profit that exists over the long run is usually found where competitive conditions persistently are less than perfect in the market. 2.1.3. Economic Rent The surplus value known as economic rent results when a particular resource or good is fixed in supply (with a vertical su
Flashcard 1436169145612
| status | not learned | measured difficulty | 37% [default] | last interval [days] | |||
|---|---|---|---|---|---|---|---|
| repetition number in this series | 0 | memorised on | scheduled repetition | ||||
| scheduled repetition interval | last repetition or drill |
Parent (intermediate) annotation
Open itExpenses relating to advertising, supplies, utilities, inventory and equipment actually purchased are examples of explicit costs. Although the depreciation of an asset is not an activity that can be tangibly traced, depreciation expense is an <span>explicit cost because it relates to the cost of the underlying asset that the company owns. <span><body><html>
Original toplevel document
Explicit Cost Definition | InvestopediaAn explicit cost is an expense that has occurred and has a clearly defined dollar amount. These expenses are incurred during business operations and are actual out-of-pocket cash outlays. The objective dollar amounts are subject to reporting. <span>Examples of Explicit Costs Net income of a business reflects residual income remaining after all explicit costs have been paid. Explicit costs are the only costs necessary to calculate accounting profit. Expenses relating to advertising, supplies, utilities, inventory and equipment actually purchased are examples of explicit costs. Although the depreciation of an asset is not an activity that can be tangibly traced, depreciation expense is an explicit cost because it relates to the cost of the underlying asset that the company owns. Explicit Costs vs. Implicit Costs Explicit costs arise based on what has actually been purchased as opposed to implicit costs that arise based on what has actually been given up other t
Flashcard 1438140992780
| status | not learned | measured difficulty | 37% [default] | last interval [days] | |||
|---|---|---|---|---|---|---|---|
| repetition number in this series | 0 | memorised on | scheduled repetition | ||||
| scheduled repetition interval | last repetition or drill |
Subject 1. Capital Budgeting: Introduction
ss of planning expenditures on assets (fixed assets) whose cash flows are expected to extend beyond one year. Managers analyze projects and decide which ones to include in the capital budget. "Capital" refers to <span>long-term assets. The "budget" is a plan which details projected cash inflows and outflows during a future period. The typical steps in the capital budgeting
ss of planning expenditures on assets (fixed assets) whose cash flows are expected to extend beyond one year. Managers analyze projects and decide which ones to include in the capital budget. "Capital" refers to <span>long-term assets. The "budget" is a plan which details projected cash inflows and outflows during a future period. The typical steps in the capital budgeting
Flashcard 1446745607436
| status | not learned | measured difficulty | 37% [default] | last interval [days] | |||
|---|---|---|---|---|---|---|---|
| repetition number in this series | 0 | memorised on | scheduled repetition | ||||
| scheduled repetition interval | last repetition or drill |
Parent (intermediate) annotation
Open itties as sales promotion, advertising, and competitive positioning of the product that would take place under the market model of imperfect competition. Under perfect competition, however, total quantity in the market is influenced strictly by <span>price, while non-price factors are not important. Once consumer preferences are established in the market, price determines the quantity demanded by buyers. Together, price and quantity const
Original toplevel document
3. ANALYSIS OF REVENUE, COSTS, AND PROFITS(AR) Marginal Revenue (MR) 0 100 0 — — 1 100 100 100 100 2 100 200 100 100 3 100 300 100 100 4 100 400 100 100 5 100 500 100 100 6 100 600 100 100 7 100 700 100 100 8 100 800 100 100 9 100 900 100 100 10 100 1,000 100 100 <span>The quantity or quantity demanded variable is the amount of the product that consumers are willing and able to buy at each price level. The quantity sold can be affected by the business through such activities as sales promotion, advertising, and competitive positioning of the product that would take place under the market model of imperfect competition. Under perfect competition, however, total quantity in the market is influenced strictly by price, while non-price factors are not important. Once consumer preferences are established in the market, price determines the quantity demanded by buyers. Together, price and quantity constitute the firm’s demand curve, which becomes the basis for calculating the total, average, and marginal revenue. In Exhibit 4, price is the market price as established by the interactions of the market demand and supply factors. Since the firm is a price taker, price is fixed at 100
Flashcard 1446787288332
| status | not learned | measured difficulty | 37% [default] | last interval [days] | |||
|---|---|---|---|---|---|---|---|
| repetition number in this series | 0 | memorised on | scheduled repetition | ||||
| scheduled repetition interval | last repetition or drill |
Parent (intermediate) annotation
Open itThe inputs in the production function are subject to the constraint that K ≥ 0 and L ≥ 0.
Original toplevel document
3. ANALYSIS OF REVENUE, COSTS, AND PROFITSationships among the revenue variables presented in Exhibit 7. Exhibit 8. Total Revenue, Average Revenue, and Marginal Revenue for Exhibit 7 Data <span>3.1.2. Factors of Production Revenue generation occurs when output is sold in the market. However, costs are incurred before revenue generation takes place as the firm purchases resources, or what are commonly known as the factors of production, in order to produce a product or service that will be offered for sale to consumers. Factors of production, the inputs to the production of goods and services, include: land, as in the site location of the business; labor, which consists of the inputs of skilled and unskilled workers as well as the inputs of firms’ managers; capital, which in this context refers to physical capital—such tangible goods as equipment, tools, and buildings. Capital goods are distinguished as inputs to production that are themselves produced goods; and materials, which in this context refers to any goods the business buys as inputs to its production process.1 For example, a business that produces solid wood office desks needs to acquire lumber and hardware accessories as raw materials and hire workers to construct and assemble the desks using power tools and equipment. The factors of production are the inputs to the firm’s process of producing and selling a product or service where the goal of the firm is to maximize profit by satisfying the demand of consumers. The types and quantities of resources or factors used in production, their respective prices, and how efficiently they are employed in the production process determine the cost component of the profit equation. Clearly, in order to produce output, the firm needs to employ factors of production. While firms may use many different types of labor, capital, raw materials, and land, an analyst may find it more convenient to limit attention to a more simplified process in which only the two factors, capital and labor, are employed. The relationship between the flow of output and the two factors of production is called the production function , and it is represented generally as: Equation (5) Q = f (K, L) where Q is the quantity of output, K is capital, and L is labor. The inputs are subject to the constraint that K ≥ 0 and L ≥ 0. A more general production function is stated as: Equation (6) Q = f (x 1 , x 2 , … x n ) where x i represents the quantity of the ith input subject to x i ≥ 0 for n number of different inputs. Exhibit 9illustrates the shape of a typical input–output relationship using labor (L) as the only variable input (all other input factors are held constant). The production function has three distinct regions where both the direction of change and the rate of change in total product (TP or Q, quantity of output) vary as production changes. Regions 1 and 2 have positive changes in TP as labor is added, but the change turns negative in Region 3. Moreover, in Region 1 (L 0 – L 1 ), TP is increasing at an increasing rate, typically because specialization allows laborers to become increasingly productive. In Region 2, however, (L 1 – L 2 ), TP is increasing at a decreasing rate because capital is fixed, and labor experiences diminishing marginal returns. The firm would want to avoid Region 3 if at all possible because total product or quantity would be declining rather than increasing with additional input: There is so little capital per unit of labor that additional laborers would possibly “get in each other’s way”. Point A is where TP is maximized. Exhibit 9. A Firm’s Production Function EXAMPLE 3 Factors of Production A group of business investor
Flashcard 1446821891340
| status | not learned | measured difficulty | 37% [default] | last interval [days] | |||
|---|---|---|---|---|---|---|---|
| repetition number in this series | 0 | memorised on | scheduled repetition | ||||
| scheduled repetition interval | last repetition or drill |
Parent (intermediate) annotation
Open itFactors of production, the inputs to the production of goods and services, include: land, as in the site location of the business; labor, which consists of the inputs of skilled and unskilled workers as well as the inputs of firms’ managers; capi
Original toplevel document
3. ANALYSIS OF REVENUE, COSTS, AND PROFITSationships among the revenue variables presented in Exhibit 7. Exhibit 8. Total Revenue, Average Revenue, and Marginal Revenue for Exhibit 7 Data <span>3.1.2. Factors of Production Revenue generation occurs when output is sold in the market. However, costs are incurred before revenue generation takes place as the firm purchases resources, or what are commonly known as the factors of production, in order to produce a product or service that will be offered for sale to consumers. Factors of production, the inputs to the production of goods and services, include: land, as in the site location of the business; labor, which consists of the inputs of skilled and unskilled workers as well as the inputs of firms’ managers; capital, which in this context refers to physical capital—such tangible goods as equipment, tools, and buildings. Capital goods are distinguished as inputs to production that are themselves produced goods; and materials, which in this context refers to any goods the business buys as inputs to its production process.1 For example, a business that produces solid wood office desks needs to acquire lumber and hardware accessories as raw materials and hire workers to construct and assemble the desks using power tools and equipment. The factors of production are the inputs to the firm’s process of producing and selling a product or service where the goal of the firm is to maximize profit by satisfying the demand of consumers. The types and quantities of resources or factors used in production, their respective prices, and how efficiently they are employed in the production process determine the cost component of the profit equation. Clearly, in order to produce output, the firm needs to employ factors of production. While firms may use many different types of labor, capital, raw materials, and land, an analyst may find it more convenient to limit attention to a more simplified process in which only the two factors, capital and labor, are employed. The relationship between the flow of output and the two factors of production is called the production function , and it is represented generally as: Equation (5) Q = f (K, L) where Q is the quantity of output, K is capital, and L is labor. The inputs are subject to the constraint that K ≥ 0 and L ≥ 0. A more general production function is stated as: Equation (6) Q = f (x 1 , x 2 , … x n ) where x i represents the quantity of the ith input subject to x i ≥ 0 for n number of different inputs. Exhibit 9illustrates the shape of a typical input–output relationship using labor (L) as the only variable input (all other input factors are held constant). The production function has three distinct regions where both the direction of change and the rate of change in total product (TP or Q, quantity of output) vary as production changes. Regions 1 and 2 have positive changes in TP as labor is added, but the change turns negative in Region 3. Moreover, in Region 1 (L 0 – L 1 ), TP is increasing at an increasing rate, typically because specialization allows laborers to become increasingly productive. In Region 2, however, (L 1 – L 2 ), TP is increasing at a decreasing rate because capital is fixed, and labor experiences diminishing marginal returns. The firm would want to avoid Region 3 if at all possible because total product or quantity would be declining rather than increasing with additional input: There is so little capital per unit of labor that additional laborers would possibly “get in each other’s way”. Point A is where TP is maximized. Exhibit 9. A Firm’s Production Function EXAMPLE 3 Factors of Production A group of business investor
Flashcard 1446824250636
| status | not learned | measured difficulty | 37% [default] | last interval [days] | |||
|---|---|---|---|---|---|---|---|
| repetition number in this series | 0 | memorised on | scheduled repetition | ||||
| scheduled repetition interval | last repetition or drill |
Parent (intermediate) annotation
Open itFactors of production, the inputs to the production of goods and services, include: land, as in the site location of the business; labor, which consists of the inputs of skilled and unskilled workers as well as the inputs of firms’ managers; capital, which in this context refers to physi
Original toplevel document
3. ANALYSIS OF REVENUE, COSTS, AND PROFITSationships among the revenue variables presented in Exhibit 7. Exhibit 8. Total Revenue, Average Revenue, and Marginal Revenue for Exhibit 7 Data <span>3.1.2. Factors of Production Revenue generation occurs when output is sold in the market. However, costs are incurred before revenue generation takes place as the firm purchases resources, or what are commonly known as the factors of production, in order to produce a product or service that will be offered for sale to consumers. Factors of production, the inputs to the production of goods and services, include: land, as in the site location of the business; labor, which consists of the inputs of skilled and unskilled workers as well as the inputs of firms’ managers; capital, which in this context refers to physical capital—such tangible goods as equipment, tools, and buildings. Capital goods are distinguished as inputs to production that are themselves produced goods; and materials, which in this context refers to any goods the business buys as inputs to its production process.1 For example, a business that produces solid wood office desks needs to acquire lumber and hardware accessories as raw materials and hire workers to construct and assemble the desks using power tools and equipment. The factors of production are the inputs to the firm’s process of producing and selling a product or service where the goal of the firm is to maximize profit by satisfying the demand of consumers. The types and quantities of resources or factors used in production, their respective prices, and how efficiently they are employed in the production process determine the cost component of the profit equation. Clearly, in order to produce output, the firm needs to employ factors of production. While firms may use many different types of labor, capital, raw materials, and land, an analyst may find it more convenient to limit attention to a more simplified process in which only the two factors, capital and labor, are employed. The relationship between the flow of output and the two factors of production is called the production function , and it is represented generally as: Equation (5) Q = f (K, L) where Q is the quantity of output, K is capital, and L is labor. The inputs are subject to the constraint that K ≥ 0 and L ≥ 0. A more general production function is stated as: Equation (6) Q = f (x 1 , x 2 , … x n ) where x i represents the quantity of the ith input subject to x i ≥ 0 for n number of different inputs. Exhibit 9illustrates the shape of a typical input–output relationship using labor (L) as the only variable input (all other input factors are held constant). The production function has three distinct regions where both the direction of change and the rate of change in total product (TP or Q, quantity of output) vary as production changes. Regions 1 and 2 have positive changes in TP as labor is added, but the change turns negative in Region 3. Moreover, in Region 1 (L 0 – L 1 ), TP is increasing at an increasing rate, typically because specialization allows laborers to become increasingly productive. In Region 2, however, (L 1 – L 2 ), TP is increasing at a decreasing rate because capital is fixed, and labor experiences diminishing marginal returns. The firm would want to avoid Region 3 if at all possible because total product or quantity would be declining rather than increasing with additional input: There is so little capital per unit of labor that additional laborers would possibly “get in each other’s way”. Point A is where TP is maximized. Exhibit 9. A Firm’s Production Function EXAMPLE 3 Factors of Production A group of business investor
Flashcard 1446827396364
| status | not learned | measured difficulty | 37% [default] | last interval [days] | |||
|---|---|---|---|---|---|---|---|
| repetition number in this series | 0 | memorised on | scheduled repetition | ||||
| scheduled repetition interval | last repetition or drill |
Parent (intermediate) annotation
Open itFactors of production, the inputs to the production of goods and services, include: land, as in the site location of the business; labor, which consists of the inputs of skilled and unskilled workers as well as the inputs of firms’ managers; capital, which in this context refers to physical capital—such tangible goods as equipment, tools, and buildings. Capital goods a
Original toplevel document
3. ANALYSIS OF REVENUE, COSTS, AND PROFITSationships among the revenue variables presented in Exhibit 7. Exhibit 8. Total Revenue, Average Revenue, and Marginal Revenue for Exhibit 7 Data <span>3.1.2. Factors of Production Revenue generation occurs when output is sold in the market. However, costs are incurred before revenue generation takes place as the firm purchases resources, or what are commonly known as the factors of production, in order to produce a product or service that will be offered for sale to consumers. Factors of production, the inputs to the production of goods and services, include: land, as in the site location of the business; labor, which consists of the inputs of skilled and unskilled workers as well as the inputs of firms’ managers; capital, which in this context refers to physical capital—such tangible goods as equipment, tools, and buildings. Capital goods are distinguished as inputs to production that are themselves produced goods; and materials, which in this context refers to any goods the business buys as inputs to its production process.1 For example, a business that produces solid wood office desks needs to acquire lumber and hardware accessories as raw materials and hire workers to construct and assemble the desks using power tools and equipment. The factors of production are the inputs to the firm’s process of producing and selling a product or service where the goal of the firm is to maximize profit by satisfying the demand of consumers. The types and quantities of resources or factors used in production, their respective prices, and how efficiently they are employed in the production process determine the cost component of the profit equation. Clearly, in order to produce output, the firm needs to employ factors of production. While firms may use many different types of labor, capital, raw materials, and land, an analyst may find it more convenient to limit attention to a more simplified process in which only the two factors, capital and labor, are employed. The relationship between the flow of output and the two factors of production is called the production function , and it is represented generally as: Equation (5) Q = f (K, L) where Q is the quantity of output, K is capital, and L is labor. The inputs are subject to the constraint that K ≥ 0 and L ≥ 0. A more general production function is stated as: Equation (6) Q = f (x 1 , x 2 , … x n ) where x i represents the quantity of the ith input subject to x i ≥ 0 for n number of different inputs. Exhibit 9illustrates the shape of a typical input–output relationship using labor (L) as the only variable input (all other input factors are held constant). The production function has three distinct regions where both the direction of change and the rate of change in total product (TP or Q, quantity of output) vary as production changes. Regions 1 and 2 have positive changes in TP as labor is added, but the change turns negative in Region 3. Moreover, in Region 1 (L 0 – L 1 ), TP is increasing at an increasing rate, typically because specialization allows laborers to become increasingly productive. In Region 2, however, (L 1 – L 2 ), TP is increasing at a decreasing rate because capital is fixed, and labor experiences diminishing marginal returns. The firm would want to avoid Region 3 if at all possible because total product or quantity would be declining rather than increasing with additional input: There is so little capital per unit of labor that additional laborers would possibly “get in each other’s way”. Point A is where TP is maximized. Exhibit 9. A Firm’s Production Function EXAMPLE 3 Factors of Production A group of business investor
Flashcard 1446830542092
| status | not learned | measured difficulty | 37% [default] | last interval [days] | |||
|---|---|---|---|---|---|---|---|
| repetition number in this series | 0 | memorised on | scheduled repetition | ||||
| scheduled repetition interval | last repetition or drill |
Parent (intermediate) annotation
Open it; land, as in the site location of the business; labor, which consists of the inputs of skilled and unskilled workers as well as the inputs of firms’ managers; capital, which in this context refers to <span>physical capital—such tangible goods as equipment, tools, and buildings. Capital goods are distinguished as inputs to production that are themselves produced goods; and materials, which in
Original toplevel document
3. ANALYSIS OF REVENUE, COSTS, AND PROFITSationships among the revenue variables presented in Exhibit 7. Exhibit 8. Total Revenue, Average Revenue, and Marginal Revenue for Exhibit 7 Data <span>3.1.2. Factors of Production Revenue generation occurs when output is sold in the market. However, costs are incurred before revenue generation takes place as the firm purchases resources, or what are commonly known as the factors of production, in order to produce a product or service that will be offered for sale to consumers. Factors of production, the inputs to the production of goods and services, include: land, as in the site location of the business; labor, which consists of the inputs of skilled and unskilled workers as well as the inputs of firms’ managers; capital, which in this context refers to physical capital—such tangible goods as equipment, tools, and buildings. Capital goods are distinguished as inputs to production that are themselves produced goods; and materials, which in this context refers to any goods the business buys as inputs to its production process.1 For example, a business that produces solid wood office desks needs to acquire lumber and hardware accessories as raw materials and hire workers to construct and assemble the desks using power tools and equipment. The factors of production are the inputs to the firm’s process of producing and selling a product or service where the goal of the firm is to maximize profit by satisfying the demand of consumers. The types and quantities of resources or factors used in production, their respective prices, and how efficiently they are employed in the production process determine the cost component of the profit equation. Clearly, in order to produce output, the firm needs to employ factors of production. While firms may use many different types of labor, capital, raw materials, and land, an analyst may find it more convenient to limit attention to a more simplified process in which only the two factors, capital and labor, are employed. The relationship between the flow of output and the two factors of production is called the production function , and it is represented generally as: Equation (5) Q = f (K, L) where Q is the quantity of output, K is capital, and L is labor. The inputs are subject to the constraint that K ≥ 0 and L ≥ 0. A more general production function is stated as: Equation (6) Q = f (x 1 , x 2 , … x n ) where x i represents the quantity of the ith input subject to x i ≥ 0 for n number of different inputs. Exhibit 9illustrates the shape of a typical input–output relationship using labor (L) as the only variable input (all other input factors are held constant). The production function has three distinct regions where both the direction of change and the rate of change in total product (TP or Q, quantity of output) vary as production changes. Regions 1 and 2 have positive changes in TP as labor is added, but the change turns negative in Region 3. Moreover, in Region 1 (L 0 – L 1 ), TP is increasing at an increasing rate, typically because specialization allows laborers to become increasingly productive. In Region 2, however, (L 1 – L 2 ), TP is increasing at a decreasing rate because capital is fixed, and labor experiences diminishing marginal returns. The firm would want to avoid Region 3 if at all possible because total product or quantity would be declining rather than increasing with additional input: There is so little capital per unit of labor that additional laborers would possibly “get in each other’s way”. Point A is where TP is maximized. Exhibit 9. A Firm’s Production Function EXAMPLE 3 Factors of Production A group of business investor
Flashcard 1446833949964
| status | not learned | measured difficulty | 37% [default] | last interval [days] | |||
|---|---|---|---|---|---|---|---|
| repetition number in this series | 0 | memorised on | scheduled repetition | ||||
| scheduled repetition interval | last repetition or drill |
Parent (intermediate) annotation
Open itCapital goods are distinguished as inputs to production that are themselves produced goods; and
Original toplevel document
3. ANALYSIS OF REVENUE, COSTS, AND PROFITSationships among the revenue variables presented in Exhibit 7. Exhibit 8. Total Revenue, Average Revenue, and Marginal Revenue for Exhibit 7 Data <span>3.1.2. Factors of Production Revenue generation occurs when output is sold in the market. However, costs are incurred before revenue generation takes place as the firm purchases resources, or what are commonly known as the factors of production, in order to produce a product or service that will be offered for sale to consumers. Factors of production, the inputs to the production of goods and services, include: land, as in the site location of the business; labor, which consists of the inputs of skilled and unskilled workers as well as the inputs of firms’ managers; capital, which in this context refers to physical capital—such tangible goods as equipment, tools, and buildings. Capital goods are distinguished as inputs to production that are themselves produced goods; and materials, which in this context refers to any goods the business buys as inputs to its production process.1 For example, a business that produces solid wood office desks needs to acquire lumber and hardware accessories as raw materials and hire workers to construct and assemble the desks using power tools and equipment. The factors of production are the inputs to the firm’s process of producing and selling a product or service where the goal of the firm is to maximize profit by satisfying the demand of consumers. The types and quantities of resources or factors used in production, their respective prices, and how efficiently they are employed in the production process determine the cost component of the profit equation. Clearly, in order to produce output, the firm needs to employ factors of production. While firms may use many different types of labor, capital, raw materials, and land, an analyst may find it more convenient to limit attention to a more simplified process in which only the two factors, capital and labor, are employed. The relationship between the flow of output and the two factors of production is called the production function , and it is represented generally as: Equation (5) Q = f (K, L) where Q is the quantity of output, K is capital, and L is labor. The inputs are subject to the constraint that K ≥ 0 and L ≥ 0. A more general production function is stated as: Equation (6) Q = f (x 1 , x 2 , … x n ) where x i represents the quantity of the ith input subject to x i ≥ 0 for n number of different inputs. Exhibit 9illustrates the shape of a typical input–output relationship using labor (L) as the only variable input (all other input factors are held constant). The production function has three distinct regions where both the direction of change and the rate of change in total product (TP or Q, quantity of output) vary as production changes. Regions 1 and 2 have positive changes in TP as labor is added, but the change turns negative in Region 3. Moreover, in Region 1 (L 0 – L 1 ), TP is increasing at an increasing rate, typically because specialization allows laborers to become increasingly productive. In Region 2, however, (L 1 – L 2 ), TP is increasing at a decreasing rate because capital is fixed, and labor experiences diminishing marginal returns. The firm would want to avoid Region 3 if at all possible because total product or quantity would be declining rather than increasing with additional input: There is so little capital per unit of labor that additional laborers would possibly “get in each other’s way”. Point A is where TP is maximized. Exhibit 9. A Firm’s Production Function EXAMPLE 3 Factors of Production A group of business investor
Flashcard 1446836309260
| status | not learned | measured difficulty | 37% [default] | last interval [days] | |||
|---|---|---|---|---|---|---|---|
| repetition number in this series | 0 | memorised on | scheduled repetition | ||||
| scheduled repetition interval | last repetition or drill |
Parent (intermediate) annotation
Open itontext refers to physical capital—such tangible goods as equipment, tools, and buildings. Capital goods are distinguished as inputs to production that are themselves produced goods; and materials, which in this context refers to <span>any goods the business buys as inputs to its production process.<span><body><html>
Original toplevel document
3. ANALYSIS OF REVENUE, COSTS, AND PROFITSationships among the revenue variables presented in Exhibit 7. Exhibit 8. Total Revenue, Average Revenue, and Marginal Revenue for Exhibit 7 Data <span>3.1.2. Factors of Production Revenue generation occurs when output is sold in the market. However, costs are incurred before revenue generation takes place as the firm purchases resources, or what are commonly known as the factors of production, in order to produce a product or service that will be offered for sale to consumers. Factors of production, the inputs to the production of goods and services, include: land, as in the site location of the business; labor, which consists of the inputs of skilled and unskilled workers as well as the inputs of firms’ managers; capital, which in this context refers to physical capital—such tangible goods as equipment, tools, and buildings. Capital goods are distinguished as inputs to production that are themselves produced goods; and materials, which in this context refers to any goods the business buys as inputs to its production process.1 For example, a business that produces solid wood office desks needs to acquire lumber and hardware accessories as raw materials and hire workers to construct and assemble the desks using power tools and equipment. The factors of production are the inputs to the firm’s process of producing and selling a product or service where the goal of the firm is to maximize profit by satisfying the demand of consumers. The types and quantities of resources or factors used in production, their respective prices, and how efficiently they are employed in the production process determine the cost component of the profit equation. Clearly, in order to produce output, the firm needs to employ factors of production. While firms may use many different types of labor, capital, raw materials, and land, an analyst may find it more convenient to limit attention to a more simplified process in which only the two factors, capital and labor, are employed. The relationship between the flow of output and the two factors of production is called the production function , and it is represented generally as: Equation (5) Q = f (K, L) where Q is the quantity of output, K is capital, and L is labor. The inputs are subject to the constraint that K ≥ 0 and L ≥ 0. A more general production function is stated as: Equation (6) Q = f (x 1 , x 2 , … x n ) where x i represents the quantity of the ith input subject to x i ≥ 0 for n number of different inputs. Exhibit 9illustrates the shape of a typical input–output relationship using labor (L) as the only variable input (all other input factors are held constant). The production function has three distinct regions where both the direction of change and the rate of change in total product (TP or Q, quantity of output) vary as production changes. Regions 1 and 2 have positive changes in TP as labor is added, but the change turns negative in Region 3. Moreover, in Region 1 (L 0 – L 1 ), TP is increasing at an increasing rate, typically because specialization allows laborers to become increasingly productive. In Region 2, however, (L 1 – L 2 ), TP is increasing at a decreasing rate because capital is fixed, and labor experiences diminishing marginal returns. The firm would want to avoid Region 3 if at all possible because total product or quantity would be declining rather than increasing with additional input: There is so little capital per unit of labor that additional laborers would possibly “get in each other’s way”. Point A is where TP is maximized. Exhibit 9. A Firm’s Production Function EXAMPLE 3 Factors of Production A group of business investor
Flashcard 1446850989324
| status | not learned | measured difficulty | 37% [default] | last interval [days] | |||
|---|---|---|---|---|---|---|---|
| repetition number in this series | 0 | memorised on | scheduled repetition | ||||
| scheduled repetition interval | last repetition or drill |
Parent (intermediate) annotation
Open itThere are three approaches to calculate the point of profit maximization. Third approach compares the revenue generated by each resource unit with the cost of that unit. Profit contribution occurs when the revenue from an input unit exceeds its cost. The point of profit maximization is reached when reso
Original toplevel document
3. ANALYSIS OF REVENUE, COSTS, AND PROFITSTotal variable cost divided by quantity; (TVC ÷ Q) Average total cost (ATC) Total cost divided by quantity; (TC ÷ Q) or (AFC + AVC) Marginal cost (MC) Change in total cost divided by change in quantity; (∆TC ÷ ∆Q) <span>3.1. Profit Maximization In free markets—and even in regulated market economies—profit maximization tends to promote economic welfare and a higher standard of living, and creates wealth for investors. Profit motivates businesses to use resources efficiently and to concentrate on activities in which they have a competitive advantage. Most economists believe that profit maximization promotes allocational efficiency—that resources flow into their highest valued uses. Overall, the functions of profit are as follows: Rewards entrepreneurs for risk taking when pursuing business ventures to satisfy consumer demand. Allocates resources to their most-efficient use; input factors flow from sectors with economic losses to sectors with economic profit, where profit reflects goods most desired by society. Spurs innovation and the development of new technology. Stimulates business investment and economic growth. There are three approaches to calculate the point of profit maximization. First, given that profit is the difference between total revenue and total costs, maximum profit occurs at the output level where this difference is the greatest. Second, maximum profit can also be calculated by comparing revenue and cost for each individual unit of output that is produced and sold. A business increases profit through greater sales as long as per-unit revenue exceeds per-unit cost on the next unit of output sold. Profit maximization takes place at the point where the last individual output unit breaks even. Beyond this point, total profit decreases because the per-unit cost is higher than the per-unit revenue from successive output units. A third approach compares the revenue generated by each resource unit with the cost of that unit. Profit contribution occurs when the revenue from an input unit exceeds its cost. The point of profit maximization is reached when resource units no longer contribute to profit. All three approaches yield the same profit-maximizing quantity of output. (These approaches will be explained in greater detail later.) Because profit is the difference between revenue and cost, an understanding of profit maximization requires that we examine both of those components. Revenue comes from the demand for the firm’s products, and cost comes from the acquisition and utilization of the firm’s inputs in the production of those products. 3.1.1. Total, Average, and Marginal Revenue This section briefly examines demand and revenue in preparation for addressing cost. Unless the firm is a pu
Flashcard 1446865407244
| status | not learned | measured difficulty | 37% [default] | last interval [days] | |||
|---|---|---|---|---|---|---|---|
| repetition number in this series | 0 | memorised on | scheduled repetition | ||||
| scheduled repetition interval | last repetition or drill |
Parent (intermediate) annotation
Open itsfy consumer demand. Allocates resources to their most-efficient use; input factors flow from sectors with economic losses to sectors with economic profit, where profit reflects goods most desired by society. Spurs <span>innovation and the development of new technology. Stimulates business investment and economic growth.<span><body><html>
Original toplevel document
3. ANALYSIS OF REVENUE, COSTS, AND PROFITSTotal variable cost divided by quantity; (TVC ÷ Q) Average total cost (ATC) Total cost divided by quantity; (TC ÷ Q) or (AFC + AVC) Marginal cost (MC) Change in total cost divided by change in quantity; (∆TC ÷ ∆Q) <span>3.1. Profit Maximization In free markets—and even in regulated market economies—profit maximization tends to promote economic welfare and a higher standard of living, and creates wealth for investors. Profit motivates businesses to use resources efficiently and to concentrate on activities in which they have a competitive advantage. Most economists believe that profit maximization promotes allocational efficiency—that resources flow into their highest valued uses. Overall, the functions of profit are as follows: Rewards entrepreneurs for risk taking when pursuing business ventures to satisfy consumer demand. Allocates resources to their most-efficient use; input factors flow from sectors with economic losses to sectors with economic profit, where profit reflects goods most desired by society. Spurs innovation and the development of new technology. Stimulates business investment and economic growth. There are three approaches to calculate the point of profit maximization. First, given that profit is the difference between total revenue and total costs, maximum profit occurs at the output level where this difference is the greatest. Second, maximum profit can also be calculated by comparing revenue and cost for each individual unit of output that is produced and sold. A business increases profit through greater sales as long as per-unit revenue exceeds per-unit cost on the next unit of output sold. Profit maximization takes place at the point where the last individual output unit breaks even. Beyond this point, total profit decreases because the per-unit cost is higher than the per-unit revenue from successive output units. A third approach compares the revenue generated by each resource unit with the cost of that unit. Profit contribution occurs when the revenue from an input unit exceeds its cost. The point of profit maximization is reached when resource units no longer contribute to profit. All three approaches yield the same profit-maximizing quantity of output. (These approaches will be explained in greater detail later.) Because profit is the difference between revenue and cost, an understanding of profit maximization requires that we examine both of those components. Revenue comes from the demand for the firm’s products, and cost comes from the acquisition and utilization of the firm’s inputs in the production of those products. 3.1.1. Total, Average, and Marginal Revenue This section briefly examines demand and revenue in preparation for addressing cost. Unless the firm is a pu
Flashcard 1448250313996
| status | not learned | measured difficulty | 37% [default] | last interval [days] | |||
|---|---|---|---|---|---|---|---|
| repetition number in this series | 0 | memorised on | scheduled repetition | ||||
| scheduled repetition interval | last repetition or drill |
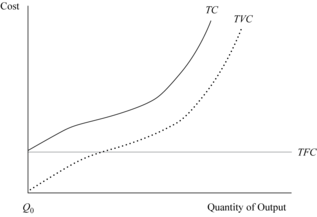
Open it
Exhibit 10 shows the graphical relationships among total costs, total fixed cost, and total variable cost. The curve for total costs is a parallel shift of the total variable cost curve and always lies above the total variable cost curve by the amount of total fixed cost. At zero production, total costs are equal to total fixed cost because total variable cost at this output level is zero
Flashcard 1448311131404
| status | not learned | measured difficulty | 37% [default] | last interval [days] | |||
|---|---|---|---|---|---|---|---|
| repetition number in this series | 0 | memorised on | scheduled repetition | ||||
| scheduled repetition interval | last repetition or drill |
Parent (intermediate) annotation
Open itThe quantity or quantity demanded variable is the amount of the product that consumers are willing and able to buy at each price level.
Original toplevel document
3. ANALYSIS OF REVENUE, COSTS, AND PROFITS(AR) Marginal Revenue (MR) 0 100 0 — — 1 100 100 100 100 2 100 200 100 100 3 100 300 100 100 4 100 400 100 100 5 100 500 100 100 6 100 600 100 100 7 100 700 100 100 8 100 800 100 100 9 100 900 100 100 10 100 1,000 100 100 <span>The quantity or quantity demanded variable is the amount of the product that consumers are willing and able to buy at each price level. The quantity sold can be affected by the business through such activities as sales promotion, advertising, and competitive positioning of the product that would take place under the market model of imperfect competition. Under perfect competition, however, total quantity in the market is influenced strictly by price, while non-price factors are not important. Once consumer preferences are established in the market, price determines the quantity demanded by buyers. Together, price and quantity constitute the firm’s demand curve, which becomes the basis for calculating the total, average, and marginal revenue. In Exhibit 4, price is the market price as established by the interactions of the market demand and supply factors. Since the firm is a price taker, price is fixed at 100
Flashcard 1448677608716
| status | not learned | measured difficulty | 37% [default] | last interval [days] | |||
|---|---|---|---|---|---|---|---|
| repetition number in this series | 0 | memorised on | scheduled repetition | ||||
| scheduled repetition interval | last repetition or drill |
Parent (intermediate) annotation
Open itontext refers to physical capital—such tangible goods as equipment, tools, and buildings. Capital goods are distinguished as inputs to production that are themselves produced goods; and materials, which in this context refers to <span>any goods the business buys as inputs to its production process.<span><body><html>
Original toplevel document
3. ANALYSIS OF REVENUE, COSTS, AND PROFITSationships among the revenue variables presented in Exhibit 7. Exhibit 8. Total Revenue, Average Revenue, and Marginal Revenue for Exhibit 7 Data <span>3.1.2. Factors of Production Revenue generation occurs when output is sold in the market. However, costs are incurred before revenue generation takes place as the firm purchases resources, or what are commonly known as the factors of production, in order to produce a product or service that will be offered for sale to consumers. Factors of production, the inputs to the production of goods and services, include: land, as in the site location of the business; labor, which consists of the inputs of skilled and unskilled workers as well as the inputs of firms’ managers; capital, which in this context refers to physical capital—such tangible goods as equipment, tools, and buildings. Capital goods are distinguished as inputs to production that are themselves produced goods; and materials, which in this context refers to any goods the business buys as inputs to its production process.1 For example, a business that produces solid wood office desks needs to acquire lumber and hardware accessories as raw materials and hire workers to construct and assemble the desks using power tools and equipment. The factors of production are the inputs to the firm’s process of producing and selling a product or service where the goal of the firm is to maximize profit by satisfying the demand of consumers. The types and quantities of resources or factors used in production, their respective prices, and how efficiently they are employed in the production process determine the cost component of the profit equation. Clearly, in order to produce output, the firm needs to employ factors of production. While firms may use many different types of labor, capital, raw materials, and land, an analyst may find it more convenient to limit attention to a more simplified process in which only the two factors, capital and labor, are employed. The relationship between the flow of output and the two factors of production is called the production function , and it is represented generally as: Equation (5) Q = f (K, L) where Q is the quantity of output, K is capital, and L is labor. The inputs are subject to the constraint that K ≥ 0 and L ≥ 0. A more general production function is stated as: Equation (6) Q = f (x 1 , x 2 , … x n ) where x i represents the quantity of the ith input subject to x i ≥ 0 for n number of different inputs. Exhibit 9illustrates the shape of a typical input–output relationship using labor (L) as the only variable input (all other input factors are held constant). The production function has three distinct regions where both the direction of change and the rate of change in total product (TP or Q, quantity of output) vary as production changes. Regions 1 and 2 have positive changes in TP as labor is added, but the change turns negative in Region 3. Moreover, in Region 1 (L 0 – L 1 ), TP is increasing at an increasing rate, typically because specialization allows laborers to become increasingly productive. In Region 2, however, (L 1 – L 2 ), TP is increasing at a decreasing rate because capital is fixed, and labor experiences diminishing marginal returns. The firm would want to avoid Region 3 if at all possible because total product or quantity would be declining rather than increasing with additional input: There is so little capital per unit of labor that additional laborers would possibly “get in each other’s way”. Point A is where TP is maximized. Exhibit 9. A Firm’s Production Function EXAMPLE 3 Factors of Production A group of business investor
Flashcard 1448680754444
| status | not learned | measured difficulty | 37% [default] | last interval [days] | |||
|---|---|---|---|---|---|---|---|
| repetition number in this series | 0 | memorised on | scheduled repetition | ||||
| scheduled repetition interval | last repetition or drill |
Parent (intermediate) annotation
Open itsfy consumer demand. Allocates resources to their most-efficient use; input factors flow from sectors with economic losses to sectors with economic profit, where profit reflects goods most desired by society. Spurs <span>innovation and the development of new technology. Stimulates business investment and economic growth.<span><body><html>
Original toplevel document
3. ANALYSIS OF REVENUE, COSTS, AND PROFITSTotal variable cost divided by quantity; (TVC ÷ Q) Average total cost (ATC) Total cost divided by quantity; (TC ÷ Q) or (AFC + AVC) Marginal cost (MC) Change in total cost divided by change in quantity; (∆TC ÷ ∆Q) <span>3.1. Profit Maximization In free markets—and even in regulated market economies—profit maximization tends to promote economic welfare and a higher standard of living, and creates wealth for investors. Profit motivates businesses to use resources efficiently and to concentrate on activities in which they have a competitive advantage. Most economists believe that profit maximization promotes allocational efficiency—that resources flow into their highest valued uses. Overall, the functions of profit are as follows: Rewards entrepreneurs for risk taking when pursuing business ventures to satisfy consumer demand. Allocates resources to their most-efficient use; input factors flow from sectors with economic losses to sectors with economic profit, where profit reflects goods most desired by society. Spurs innovation and the development of new technology. Stimulates business investment and economic growth. There are three approaches to calculate the point of profit maximization. First, given that profit is the difference between total revenue and total costs, maximum profit occurs at the output level where this difference is the greatest. Second, maximum profit can also be calculated by comparing revenue and cost for each individual unit of output that is produced and sold. A business increases profit through greater sales as long as per-unit revenue exceeds per-unit cost on the next unit of output sold. Profit maximization takes place at the point where the last individual output unit breaks even. Beyond this point, total profit decreases because the per-unit cost is higher than the per-unit revenue from successive output units. A third approach compares the revenue generated by each resource unit with the cost of that unit. Profit contribution occurs when the revenue from an input unit exceeds its cost. The point of profit maximization is reached when resource units no longer contribute to profit. All three approaches yield the same profit-maximizing quantity of output. (These approaches will be explained in greater detail later.) Because profit is the difference between revenue and cost, an understanding of profit maximization requires that we examine both of those components. Revenue comes from the demand for the firm’s products, and cost comes from the acquisition and utilization of the firm’s inputs in the production of those products. 3.1.1. Total, Average, and Marginal Revenue This section briefly examines demand and revenue in preparation for addressing cost. Unless the firm is a pu
Flashcard 1448683900172
| status | not learned | measured difficulty | 37% [default] | last interval [days] | |||
|---|---|---|---|---|---|---|---|
| repetition number in this series | 0 | memorised on | scheduled repetition | ||||
| scheduled repetition interval | last repetition or drill |
Parent (intermediate) annotation
Open itsfy consumer demand. Allocates resources to their most-efficient use; input factors flow from sectors with economic losses to sectors with economic profit, where profit reflects goods most desired by society. Spurs <span>innovation and the development of new technology. Stimulates business investment and economic growth.<span><body><html>
Original toplevel document
3. ANALYSIS OF REVENUE, COSTS, AND PROFITSTotal variable cost divided by quantity; (TVC ÷ Q) Average total cost (ATC) Total cost divided by quantity; (TC ÷ Q) or (AFC + AVC) Marginal cost (MC) Change in total cost divided by change in quantity; (∆TC ÷ ∆Q) <span>3.1. Profit Maximization In free markets—and even in regulated market economies—profit maximization tends to promote economic welfare and a higher standard of living, and creates wealth for investors. Profit motivates businesses to use resources efficiently and to concentrate on activities in which they have a competitive advantage. Most economists believe that profit maximization promotes allocational efficiency—that resources flow into their highest valued uses. Overall, the functions of profit are as follows: Rewards entrepreneurs for risk taking when pursuing business ventures to satisfy consumer demand. Allocates resources to their most-efficient use; input factors flow from sectors with economic losses to sectors with economic profit, where profit reflects goods most desired by society. Spurs innovation and the development of new technology. Stimulates business investment and economic growth. There are three approaches to calculate the point of profit maximization. First, given that profit is the difference between total revenue and total costs, maximum profit occurs at the output level where this difference is the greatest. Second, maximum profit can also be calculated by comparing revenue and cost for each individual unit of output that is produced and sold. A business increases profit through greater sales as long as per-unit revenue exceeds per-unit cost on the next unit of output sold. Profit maximization takes place at the point where the last individual output unit breaks even. Beyond this point, total profit decreases because the per-unit cost is higher than the per-unit revenue from successive output units. A third approach compares the revenue generated by each resource unit with the cost of that unit. Profit contribution occurs when the revenue from an input unit exceeds its cost. The point of profit maximization is reached when resource units no longer contribute to profit. All three approaches yield the same profit-maximizing quantity of output. (These approaches will be explained in greater detail later.) Because profit is the difference between revenue and cost, an understanding of profit maximization requires that we examine both of those components. Revenue comes from the demand for the firm’s products, and cost comes from the acquisition and utilization of the firm’s inputs in the production of those products. 3.1.1. Total, Average, and Marginal Revenue This section briefly examines demand and revenue in preparation for addressing cost. Unless the firm is a pu
Flashcard 1448685735180
| status | not learned | measured difficulty | 37% [default] | last interval [days] | |||
|---|---|---|---|---|---|---|---|
| repetition number in this series | 0 | memorised on | scheduled repetition | ||||
| scheduled repetition interval | last repetition or drill |
Parent (intermediate) annotation
Open itsfy consumer demand. Allocates resources to their most-efficient use; input factors flow from sectors with economic losses to sectors with economic profit, where profit reflects goods most desired by society. Spurs <span>innovation and the development of new technology. Stimulates business investment and economic growth.<span><body><html>
Original toplevel document
3. ANALYSIS OF REVENUE, COSTS, AND PROFITSTotal variable cost divided by quantity; (TVC ÷ Q) Average total cost (ATC) Total cost divided by quantity; (TC ÷ Q) or (AFC + AVC) Marginal cost (MC) Change in total cost divided by change in quantity; (∆TC ÷ ∆Q) <span>3.1. Profit Maximization In free markets—and even in regulated market economies—profit maximization tends to promote economic welfare and a higher standard of living, and creates wealth for investors. Profit motivates businesses to use resources efficiently and to concentrate on activities in which they have a competitive advantage. Most economists believe that profit maximization promotes allocational efficiency—that resources flow into their highest valued uses. Overall, the functions of profit are as follows: Rewards entrepreneurs for risk taking when pursuing business ventures to satisfy consumer demand. Allocates resources to their most-efficient use; input factors flow from sectors with economic losses to sectors with economic profit, where profit reflects goods most desired by society. Spurs innovation and the development of new technology. Stimulates business investment and economic growth. There are three approaches to calculate the point of profit maximization. First, given that profit is the difference between total revenue and total costs, maximum profit occurs at the output level where this difference is the greatest. Second, maximum profit can also be calculated by comparing revenue and cost for each individual unit of output that is produced and sold. A business increases profit through greater sales as long as per-unit revenue exceeds per-unit cost on the next unit of output sold. Profit maximization takes place at the point where the last individual output unit breaks even. Beyond this point, total profit decreases because the per-unit cost is higher than the per-unit revenue from successive output units. A third approach compares the revenue generated by each resource unit with the cost of that unit. Profit contribution occurs when the revenue from an input unit exceeds its cost. The point of profit maximization is reached when resource units no longer contribute to profit. All three approaches yield the same profit-maximizing quantity of output. (These approaches will be explained in greater detail later.) Because profit is the difference between revenue and cost, an understanding of profit maximization requires that we examine both of those components. Revenue comes from the demand for the firm’s products, and cost comes from the acquisition and utilization of the firm’s inputs in the production of those products. 3.1.1. Total, Average, and Marginal Revenue This section briefly examines demand and revenue in preparation for addressing cost. Unless the firm is a pu
Flashcard 1448747863308

| status | not learned | measured difficulty | 37% [default] | last interval [days] | |||
|---|---|---|---|---|---|---|---|
| repetition number in this series | 0 | memorised on | scheduled repetition | ||||
| scheduled repetition interval | last repetition or drill |
Open it
d MC in the short run. The marginal cost curve intersects both the ATC and AVC at their respective minimum points. This occurs at points S and T, which correspond to Q AVC and Q ATC , respectively. Mathematically, when <span>marginal cost is less than average variable cost, AVC will be decreasing . The opposite occurs when MC is greater than AVC. The same relationship holds true for MC and ATC . ATC declines when MC is less than ATC. ATC increases as MC exceeds ATC
Flashcard 1449951890700
| status | not learned | measured difficulty | 37% [default] | last interval [days] | |||
|---|---|---|---|---|---|---|---|
| repetition number in this series | 0 | memorised on | scheduled repetition | ||||
| scheduled repetition interval | last repetition or drill |
Parent (intermediate) annotation
Open itmerger or acquisition candidate. Evaluating a subsidiary or operating division of a parent company. Deciding whether to make a venture capital or other private equity investment. Determining the <span>creditworthiness of a company in order to decide whether to extend a loan to the company and if so, what terms to offer. <span><body><html>
Original toplevel document
2. SCOPE OF FINANCIAL STATEMENT ANALYSISing, and financing decisions but do not necessarily rely on analysis of related financial statements. They have access to additional financial information that can be reported in whatever format is most useful to their decision.) <span>In evaluating financial reports, analysts typically have a specific economic decision in mind. Examples of these decisions include the following: Evaluating an equity investment for inclusion in a portfolio. Evaluating a merger or acquisition candidate. Evaluating a subsidiary or operating division of a parent company. Deciding whether to make a venture capital or other private equity investment. Determining the creditworthiness of a company in order to decide whether to extend a loan to the company and if so, what terms to offer. Extending credit to a customer. Examining compliance with debt covenants or other contractual arrangements. Assigning a debt rating to a company or bond issue. Valuing a security for making an investment recommendation to others. Forecasting future net income and cash flow. These decisions demonstrate certain themes in financial analysis. In general, analysts seek to examine the past and current performance and financial position of a
Flashcard 1450244181260
| status | not learned | measured difficulty | 37% [default] | last interval [days] | |||
|---|---|---|---|---|---|---|---|
| repetition number in this series | 0 | memorised on | scheduled repetition | ||||
| scheduled repetition interval | last repetition or drill |
Parent (intermediate) annotation
Open itTotal fixed cost (TFC) can be a sunk or unavoidable cost that a firm has to cover whether it produces anything or not, or it can be a cost that stays the same over a range of production but can change to another constant level when production moves outside of that range.
Original toplevel document
Costsrate of change in total variable cost. In Exhibit 13, TC at 5 units is 400—of which 300 is variable cost and 100 is fixed cost. At 10 units, total costs are 1,650, which is the sum of 1,550 in variable cost and 100 in fixed cost. <span>Total fixed cost (TFC) is the summation of all expenses that do not change when production varies. It can be a sunk or unavoidable cost that a firm has to cover whether it produces anything or not, or it can be a cost that stays the same over a range of production but can change to another constant level when production moves outside of that range. The latter is referred to as a quasi-fixed cost , although it remains categorized as part of TFC. Examples of fixed costs are debt service, real estate lease agreements, and rental contracts. Quasi-fixed cost examples would be certain utilities and administrative salaries that could be avoided or be lower when output is zero but would assume higher constant values over different production ranges. Normal profit is considered to be a fixed cost because it is a return required by investors on their equity capital regardless of output level. At zero output, total costs are always equal to the amount of total fixed cost that is incurred at this production point. In Exhibit 13, total fixed cost remains at 100 throughout the entire production range. Other fixed costs evolve primarily from investments in such fixed assets as real estate, production facilities, and equipment. As a firm grows in size, fixed asset expansion occurs along with a related increase in fixed cost. However, fixed cost cannot be arbitrarily cut when production declines. Regardless of the volume of output, an investment in a given level of fixed assets locks the firm into a certain amount of fixed cost that is used to finance the physical capital base, technology, and other capital assets. When a firm downsizes, the last expense to be cut is usually fixed cost. Total variable cost (TVC), which is the summation of all variable expenses, has a direct relationship with quantity. When quantity increases, total variable cost increases
Flashcard 1450634513676
| status | not learned | measured difficulty | 37% [default] | last interval [days] | |||
|---|---|---|---|---|---|---|---|
| repetition number in this series | 0 | memorised on | scheduled repetition | ||||
| scheduled repetition interval | last repetition or drill |
Parent (intermediate) annotation
Open itHow is the concept of economic rent useful in financial analysis? Commodities or resources that command economic rent have the potential to reward equity investors more than what is required to attract their capital to that activity, resulting in greater shareholders’ wealth.
Original toplevel document
2. OBJECTIVES OF THE FIRMer competing firms to compete away any economic profit over the long run. Economic profit that exists over the long run is usually found where competitive conditions persistently are less than perfect in the market. <span>2.1.3. Economic Rent The surplus value known as economic rent results when a particular resource or good is fixed in supply (with a vertical supply curve) and market price is higher than what is required to bring the resource or good onto the market and sustain its use. Essentially, demand determines the price level and the magnitude of economic rent that is forthcoming from the market. Exhibit 1 illustrates this concept, where P 1 is the price level that yields a normal profit return to the business that supplies the item. When demand increases from Demand 1 to Demand 2 , price rises to P 2 , where at this higher price level economic rent is created. The amount of this economic rent is calculated as (P 2 – P 1 ) × Q 1 . The firm has not done anything internally to merit this special reward: It benefits from an increase in demand in conjunction with a supply curve that does not fully adjust with an increase in quantity when price rises. Exhibit 1. Economic Rent Because of their limited availability in nature, certain resources—such as land and specialty commodities—possess highly inelastic supply curves in both the short run and long run (shown in Exhibit 1 as a vertical supply curve). When supply is relatively inelastic, a high degree of market demand can result in pricing that creates economic rent. This economic rent results from the fact that when price increases, the quantity supplied does not change or, at the most, increases only slightly. This is because of the fixation of supply by nature or by such artificial constraints as government policy. How is the concept of economic rent useful in financial analysis? Commodities or resources that command economic rent have the potential to reward equity investors more than what is required to attract their capital to that activity, resulting in greater shareholders’ wealth. Evidence of economic rent attracts additional capital funds to the economic endeavor. This new investment capital increases shareholders’ value as investors bid up share prices of existing firms. Any commodity, resource, or good that is fixed or nearly fixed in supply has the potential to yield economic rent. From an analytical perspective, one can obtain industry supply data to calculate the elasticity of supply , which measures the sensitivity of quantity supplied to a change in price. If quantity supplied is relatively unresponsive ( inelastic ) to price changes, then a potential condition exists in the market for economic rent. A reliable forecast of changes in demand can indicate the degree of any economic rent that is forthcoming from the market in the future. When one is analyzing fixed or nearly fixed supply markets (e.g., gold), a fundamental comprehension of demand determinants is necessary to make rational financial decisions based on potential economic rent. EXAMPLE 1 Economic Rent and Investment Decision Making The following market data show the global demand, global supply, and price on an annual basis for gold over the period 2006–2008. Based on the data, what observation can be made about market demand, supply, and economic rent? Year 2006 2007 2008 Percent Change 2006–2008 Supply (in metric tons) 3,569 3,475 3,508 –1.7 Demand (in metric tons) 3,423 3,552 3,805 +11.2 Average spot price (in US$) 603.92 695.39 871.65 +44.3 Source: GFMS and World Gold Council. Solution: The amount of total gold supplied to the world market over this period has actually declined slightly by 1.7 percent during a period when there was a double-digit increase of 11.2 percent in demand. As a consequence, the spot price has dramatically increased by 44.3 percent. Economic rent has resulted from this market relationship of a relatively fixed supply of gold and a rising demand for it. 2.2. Comparison of Profit Measures All three types of profit are interconnected because, according to Equation 4, acco
Flashcard 1450636872972
| status | not learned | measured difficulty | 37% [default] | last interval [days] | |||
|---|---|---|---|---|---|---|---|
| repetition number in this series | 0 | memorised on | scheduled repetition | ||||
| scheduled repetition interval | last repetition or drill |
Parent (intermediate) annotation
Open itAny commodity, resource, or good that is fixed or nearly fixed in supply has the potential to yield economic rent. From an analytical perspective, one can obtain industry supply data to calculate the elasticity of supply , which measures the sensitivity of quantity supplied to a change in price. If
Original toplevel document
2. OBJECTIVES OF THE FIRMer competing firms to compete away any economic profit over the long run. Economic profit that exists over the long run is usually found where competitive conditions persistently are less than perfect in the market. <span>2.1.3. Economic Rent The surplus value known as economic rent results when a particular resource or good is fixed in supply (with a vertical supply curve) and market price is higher than what is required to bring the resource or good onto the market and sustain its use. Essentially, demand determines the price level and the magnitude of economic rent that is forthcoming from the market. Exhibit 1 illustrates this concept, where P 1 is the price level that yields a normal profit return to the business that supplies the item. When demand increases from Demand 1 to Demand 2 , price rises to P 2 , where at this higher price level economic rent is created. The amount of this economic rent is calculated as (P 2 – P 1 ) × Q 1 . The firm has not done anything internally to merit this special reward: It benefits from an increase in demand in conjunction with a supply curve that does not fully adjust with an increase in quantity when price rises. Exhibit 1. Economic Rent Because of their limited availability in nature, certain resources—such as land and specialty commodities—possess highly inelastic supply curves in both the short run and long run (shown in Exhibit 1 as a vertical supply curve). When supply is relatively inelastic, a high degree of market demand can result in pricing that creates economic rent. This economic rent results from the fact that when price increases, the quantity supplied does not change or, at the most, increases only slightly. This is because of the fixation of supply by nature or by such artificial constraints as government policy. How is the concept of economic rent useful in financial analysis? Commodities or resources that command economic rent have the potential to reward equity investors more than what is required to attract their capital to that activity, resulting in greater shareholders’ wealth. Evidence of economic rent attracts additional capital funds to the economic endeavor. This new investment capital increases shareholders’ value as investors bid up share prices of existing firms. Any commodity, resource, or good that is fixed or nearly fixed in supply has the potential to yield economic rent. From an analytical perspective, one can obtain industry supply data to calculate the elasticity of supply , which measures the sensitivity of quantity supplied to a change in price. If quantity supplied is relatively unresponsive ( inelastic ) to price changes, then a potential condition exists in the market for economic rent. A reliable forecast of changes in demand can indicate the degree of any economic rent that is forthcoming from the market in the future. When one is analyzing fixed or nearly fixed supply markets (e.g., gold), a fundamental comprehension of demand determinants is necessary to make rational financial decisions based on potential economic rent. EXAMPLE 1 Economic Rent and Investment Decision Making The following market data show the global demand, global supply, and price on an annual basis for gold over the period 2006–2008. Based on the data, what observation can be made about market demand, supply, and economic rent? Year 2006 2007 2008 Percent Change 2006–2008 Supply (in metric tons) 3,569 3,475 3,508 –1.7 Demand (in metric tons) 3,423 3,552 3,805 +11.2 Average spot price (in US$) 603.92 695.39 871.65 +44.3 Source: GFMS and World Gold Council. Solution: The amount of total gold supplied to the world market over this period has actually declined slightly by 1.7 percent during a period when there was a double-digit increase of 11.2 percent in demand. As a consequence, the spot price has dramatically increased by 44.3 percent. Economic rent has resulted from this market relationship of a relatively fixed supply of gold and a rising demand for it. 2.2. Comparison of Profit Measures All three types of profit are interconnected because, according to Equation 4, acco
Flashcard 1450642377996
| status | not learned | measured difficulty | 37% [default] | last interval [days] | |||
|---|---|---|---|---|---|---|---|
| repetition number in this series | 0 | memorised on | scheduled repetition | ||||
| scheduled repetition interval | last repetition or drill |
Parent (intermediate) annotation
Open itUnder any form of imperfect competition, price to the firm declines when a greater quantity is offered to the market; price to the firm increases when a lower quantity is offered to the market.
Original toplevel document
3. ANALYSIS OF REVENUE, COSTS, AND PROFITSzation requires that we examine both of those components. Revenue comes from the demand for the firm’s products, and cost comes from the acquisition and utilization of the firm’s inputs in the production of those products. <span>3.1.1. Total, Average, and Marginal Revenue This section briefly examines demand and revenue in preparation for addressing cost. Unless the firm is a pure monopolist (i.e., the only seller in its market), there is a difference between market demand and the demand facing an individual firm. A later reading will devote much more time to understanding the various competitive environments (perfect competition, monopolistic competition, oligopoly, and monopoly), known as market structure . To keep the analysis simple at this point, we will note that competition could be either perfect or imperfect. In perfect competition , the individual firm has virtually no impact on market price, because it is assumed to be a very small seller among a very large number of firms selling essentially identical products. Such a firm is called a price taker . In the second case, the firm does have at least some control over the price at which it sells its product because it must lower its price to sell more units. Exhibit 4 presents total, average, and marginal revenue data for a firm under the assumption that the firm is price taker at each relevant level of quantity of goods sold. Consequently, the individual seller faces a horizontal demand curve over relevant output ranges at the price level established by the market (see Exhibit 5). The seller can offer any quantity at this set market price without affecting price. In contrast, imperfect competition is where an individual firm has enough share of the market (or can control a certain segment of the market) and is therefore able to exert some influence over price. Instead of a large number of competing firms, imperfect competition involves a smaller number of firms in the market relative to perfect competition and in the extreme case only one firm (i.e., monopoly). Under any form of imperfect competition, the individual seller confronts a negatively sloped demand curve, where price and the quantity demanded by consumers are inversely related. In this case, price to the firm declines when a greater quantity is offered to the market; price to the firm increases when a lower quantity is offered to the market. This is shown in Exhibits 6 and 7. Exhibit 4. Total, Average, and Marginal Revenue under Perfect Competition Quantity Sold (Q) Price (P) Total Revenue (TR) Average Re
Flashcard 1450665708812
| status | not learned | measured difficulty | 37% [default] | last interval [days] | |||
|---|---|---|---|---|---|---|---|
| repetition number in this series | 0 | memorised on | scheduled repetition | ||||
| scheduled repetition interval | last repetition or drill |
Parent (intermediate) annotation
Open itOver an initial range of production, average variable cost declines and then reaches a minimum point. Thereafter, cost increases as the firm utilizes more of its production capacity. This higher cost results primarily from production constraints imposed by the fixed assets at higher volume levels. The minimum point on the AVC coincides with the lowest average varia
Original toplevel document
Open itAverage variable cost (AVC) is derived by dividing total variable cost by quantity. For example, average variable cost at 5 units is (300 ÷ 5) or 60. Over an initial range of production, average variable cost declines and then reaches a minimum point. Thereafter, cost increases as the firm utilizes more of its production capacity. This higher cost results primarily from production constraints imposed by the fixed assets at higher volume levels. The minimum point on the AVC coincides with the lowest average variable cost. However, the minimum point on the AVC does not correspond to the least-cost quantity for average total cost. In Exhibit 13, average variable cost is minimized at 2 units, whereas average total cost is the lowest at 3 units. Average total cost (ATC) is calculated by dividing total costs by quantity or by summing average fixed cost and average variable cost. For instance, in Exhibit 13, at 8 un
Flashcard 1450689301772
| status | not learned | measured difficulty | 37% [default] | last interval [days] | |||
|---|---|---|---|---|---|---|---|
| repetition number in this series | 0 | memorised on | scheduled repetition | ||||
| scheduled repetition interval | last repetition or drill |
Parent (intermediate) annotation
Open itThe minimum point on the ATC curve is consistent with maximizing profit per-unit, but it is not necessarily consistent with maximizing total profit.
Original toplevel document
Open itcost. However, the minimum point on the AVC does not correspond to the least-cost quantity for average total cost. In Exhibit 13, average variable cost is minimized at 2 units, whereas average total cost is the lowest at 3 units. <span>Average total cost (ATC) is calculated by dividing total costs by quantity or by summing average fixed cost and average variable cost. For instance, in Exhibit 13, at 8 units ATC is 125 [calculated as (1,000 ÷ 8) or (AFC + AVC = 12.5 + 112.5)]. Average total cost is often referenced as per-unit cost and is frequently called average cost. The minimum point on the average total cost curve defines the output level that has the least cost. The cost-minimizing behavior of the firm would dictate operating at the minimum point on its ATC curve. However, the quantity that maximizes profit (such as Q 3 in Exhibit 17) may not correspond to the ATC-minimum point. The minimum point on the ATC curve is consistent with maximizing profit per-unit, but it is not necessarily consistent with maximizing total profit. In Exhibit 13, the least-cost point of production is 3 units; ATC is 75, derived as [(225 ÷ 3) or (33.3 + 41.7)]. Any other production level results in a higher ATC. Marginal cost (MC) is the change in total cost divided by the change in quantity. Marginal cost also can be calculated by taking the change in total variable cost and divi
Flashcard 1450693496076
| status | not learned | measured difficulty | 37% [default] | last interval [days] | |||
|---|---|---|---|---|---|---|---|
| repetition number in this series | 0 | memorised on | scheduled repetition | ||||
| scheduled repetition interval | last repetition or drill |
Parent (intermediate) annotation
Open itMarginal cost follows a J-shaped pattern whereby cost initially declines but turns higher at some point in reflection of rising costs at higher production volumes.
Original toplevel document
Open itit is not necessarily consistent with maximizing total profit. In Exhibit 13, the least-cost point of production is 3 units; ATC is 75, derived as [(225 ÷ 3) or (33.3 + 41.7)]. Any other production level results in a higher ATC. <span>Marginal cost (MC) is the change in total cost divided by the change in quantity. Marginal cost also can be calculated by taking the change in total variable cost and dividing by the change in quantity. It represents the cost of producing an additional unit. For example, at 9 units marginal cost is 300, calculated as [(1,300 – 1,000) ÷ (9 – 8)]. Marginal cost follows a J-shaped pattern whereby cost initially declines but turns higher at some point in reflection of rising costs at higher production volumes. In Exhibit 13, MC is the lowest at 2 units of output with a value of 25, derived as [(175 – 150) ÷ (2 – 1)]. <span><body><html>
Flashcard 1450720759052
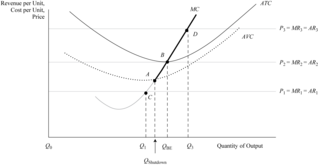
| status | not learned | measured difficulty | 37% [default] | last interval [days] | |||
|---|---|---|---|---|---|---|---|
| repetition number in this series | 0 | memorised on | scheduled repetition | ||||
| scheduled repetition interval | last repetition or drill |
Parent (intermediate) annotation
Open itShutdown is defined as a situation in which the firm stops production but still confronts the payment of fixed costs in the short run as a business entity.
Original toplevel document
Open itum point on ATC), such as point D, generates an economic profit. A firm’s shutdown point occurs when average revenue is less than average variable cost (any output below Q shutdown ), which corresponds to point A in Exhibit 17. <span>Shutdown is defined as a situation in which the firm stops production but still confronts the payment of fixed costs in the short run as a business entity. In the short run, a business is capable of operating in a loss situation as long as it covers its variable costs even though it is not earning sufficient revenue to cover all fixed cost
Flashcard 1450748022028
| status | not learned | measured difficulty | 37% [default] | last interval [days] | |||
|---|---|---|---|---|---|---|---|
| repetition number in this series | 0 | memorised on | scheduled repetition | ||||
| scheduled repetition interval | last repetition or drill |
Parent (intermediate) annotation
Open itIn thecase of perfect competition, breakeven point is also defined as the quantity where total revenue equals total costs. Firms strive to reach initial breakeven as soon as possible to avoid start-up losses for any extended period of time.
Original toplevel document
Open itn where economic profit occurs because price is greater than ATC. In the case of perfect competition, the breakeven point is the quantity where price, average revenue, and marginal revenue equal average total cost. <span>It is also defined as the quantity where total revenue equals total costs. Firms strive to reach initial breakeven as soon as possible to avoid start-up losses for any extended period of time. When businesses are first established, there is an initial period where losses occur at low quantity levels. In Exhibit 17, the breakeven quantity occurs at output Q BE , which correspo
Flashcard 1450784722188
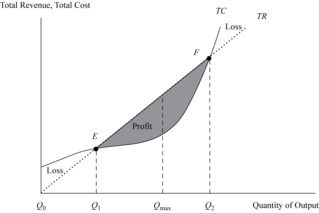
| status | not learned | measured difficulty | 37% [default] | last interval [days] | |||
|---|---|---|---|---|---|---|---|
| repetition number in this series | 0 | memorised on | scheduled repetition | ||||
| scheduled repetition interval | last repetition or drill |
Parent (intermediate) annotation
Open itA high initial breakeven point is riskier than a low point because it takes a larger volume and, usually, a longer time to reach. However, at higher output levels it yields more return in compensation for this greate
Original toplevel document
Open itmal production point that maximizes profit. Breakeven points, profit regions, and economic loss ranges are influenced by demand and supply conditions, which change frequently according to the market behavior of consumers and firms. <span>A high initial breakeven point is riskier than a low point because it takes a larger volume and, usually, a longer time to reach. However, at higher output levels it yields more return in compensation for this greater risk.<span><body><html>
Flashcard 1451358031116
| status | not learned | measured difficulty | 37% [default] | last interval [days] | |||
|---|---|---|---|---|---|---|---|
| repetition number in this series | 0 | memorised on | scheduled repetition | ||||
| scheduled repetition interval | last repetition or drill |
Open it
The firm must cover variable cost before fixed cost. In the short run, if total revenue cannot cover total variable cost, the firm shuts down production to minimize loss, which would equal the amount of fixed
The firm must cover variable cost before fixed cost. In the short run, if total revenue cannot cover total variable cost, the firm shuts down production to minimize loss, which would equal the amount of fixed
Flashcard 1451375332620
| status | not learned | measured difficulty | 37% [default] | last interval [days] | |||
|---|---|---|---|---|---|---|---|
| repetition number in this series | 0 | memorised on | scheduled repetition | ||||
| scheduled repetition interval | last repetition or drill |
Parent (intermediate) annotation
Open itRevenue–Cost Relationship Short-Run Decision Long-Term Decision TR ≥ TC Stay in market Stay in market TR > TVC but TR < TFC + TVC Stay in market Exit market TR < TVC Shut down production to zero Exit market
Original toplevel document
Open itWhen total revenue is enough to cover total variable cost but not all of total fixed cost, the firm can survive in the short run but will be unable to maintain financial solvency in the long run. Exhibit 21 <span>Revenue–Cost Relationship Short-Run Decision Long-Term Decision TR ≥ TC Stay in market Stay in market TR > TVC but TR < TFC + TVC Stay in market Exit market TR < TVC Shut down production to zero Exit market <span><body><html>
Flashcard 1451379264780
| status | not learned | measured difficulty | 37% [default] | last interval [days] | |||
|---|---|---|---|---|---|---|---|
| repetition number in this series | 0 | memorised on | scheduled repetition | ||||
| scheduled repetition interval | last repetition or drill |
Shutdown Analysis
For the most recent financial reporting period, a business domiciled in Ecuador (which recognizes the US dollar as an official currency) has revenue of $2 million and total costs of $2.5 million, which are or can be broken down into total fixed cost of $1 million and total variable cost of $1.5 million. The net loss on the firm’s income statement is reported as $500,000 (ignoring tax implications). In prior periods, the firm had reported profits on its operations. What decision should the firm make regarding operations over the short term? What decision should the firm make regarding operations over the long term? Assume the same business scenario except that revenue is now $1.3 million, wh
For the most recent financial reporting period, a business domiciled in Ecuador (which recognizes the US dollar as an official currency) has revenue of $2 million and total costs of $2.5 million, which are or can be broken down into total fixed cost of $1 million and total variable cost of $1.5 million. The net loss on the firm’s income statement is reported as $500,000 (ignoring tax implications). In prior periods, the firm had reported profits on its operations. What decision should the firm make regarding operations over the short term? What decision should the firm make regarding operations over the long term? Assume the same business scenario except that revenue is now $1.3 million, wh
Flashcard 1451385556236
| status | not learned | measured difficulty | 37% [default] | last interval [days] | |||
|---|---|---|---|---|---|---|---|
| repetition number in this series | 0 | memorised on | scheduled repetition | ||||
| scheduled repetition interval | last repetition or drill |
Shutdown Analysis
For the most recent financial reporting period, a business domiciled in Ecuador (which recognizes the US dollar as an official currency) has revenue of $2 million and total costs of $2.5 million, which are or can be broken down into total fixed cost of $1 million and total variable cost of $1.5 million. The net loss on the firm’s income statement is reported as $500,000 (ignoring tax implications). In prior periods, the firm had reported profits on its operations. What decision should the firm make regarding operations over the short term? What decision should the firm make regarding operations over the long term? Assume the same business scenario except that revenue is now $1.3 million, which creates a net loss of $1.2 million. What decision should the firm make regarding operations in this case? Solution to 1: In the short run, the firm is able to cover all of its total variable cost but only half of its $1 million in total fixed cost. I
For the most recent financial reporting period, a business domiciled in Ecuador (which recognizes the US dollar as an official currency) has revenue of $2 million and total costs of $2.5 million, which are or can be broken down into total fixed cost of $1 million and total variable cost of $1.5 million. The net loss on the firm’s income statement is reported as $500,000 (ignoring tax implications). In prior periods, the firm had reported profits on its operations. What decision should the firm make regarding operations over the short term? What decision should the firm make regarding operations over the long term? Assume the same business scenario except that revenue is now $1.3 million, which creates a net loss of $1.2 million. What decision should the firm make regarding operations in this case? Solution to 1: In the short run, the firm is able to cover all of its total variable cost but only half of its $1 million in total fixed cost. I
Flashcard 1451390536972
| status | not learned | measured difficulty | 37% [default] | last interval [days] | |||
|---|---|---|---|---|---|---|---|
| repetition number in this series | 0 | memorised on | scheduled repetition | ||||
| scheduled repetition interval | last repetition or drill |
Open it
When evaluating profitability, particularly of start-up firms and businesses using turnaround strategies, analysts should consider highlighting breakeven and shutdown points in their financial research. Identifying the unit sales levels where the firm enters or leaves the production range for profitability and where the firm can no longe
When evaluating profitability, particularly of start-up firms and businesses using turnaround strategies, analysts should consider highlighting breakeven and shutdown points in their financial research. Identifying the unit sales levels where the firm enters or leaves the production range for profitability and where the firm can no longe
Flashcard 1453799116044
| status | not learned | measured difficulty | 37% [default] | last interval [days] | |||
|---|---|---|---|---|---|---|---|
| repetition number in this series | 0 | memorised on | scheduled repetition | ||||
| scheduled repetition interval | last repetition or drill |
Parent (intermediate) annotation
Open itAn indifference curve map represents our consumer’s entire utility function.
Original toplevel document
3. UTILITY THEORY: MODELING PREFERENCES AND TASTESand lying above and to the right of the first one. Indeed, we could construct any number of indifference curves in the same manner simply by starting at a different initial bundle. The result is an entire family of indifference curves, called <span>an indifference curve map , and it represents our consumer’s entire utility function. The word map is appropriate because the entire set of indifference curves comprises a contour map of this consumer’s utility function. Each contour, or indifference curve, is a set of p
Flashcard 1453815368972
| status | not learned | measured difficulty | 37% [default] | last interval [days] | |||
|---|---|---|---|---|---|---|---|
| repetition number in this series | 0 | memorised on | scheduled repetition | ||||
| scheduled repetition interval | last repetition or drill |
Parent (intermediate) annotation
Open itProfit maximization occurs when the difference between total revenue (TR) and total costs (TC) is the greatest; marginal revenue (MR) equals marginal cost (MC); and the revenue value of the output from the last unit of input employed equals the cost of employing that input unit
Original toplevel document
3.1.4. Output Optimization and Maximization of ProfitProfit maximization occurs when the difference between total revenue (TR) and total costs (TC) is the greatest; marginal revenue (MR) equals marginal cost (MC); and the revenue value of the output from the last unit of input employed equals the cost of employing that input unit (as later developed in Equation 12). All three approaches derive the same profit-maximizing output level. In the first approach, a firm starts by forecasting unit s
Flashcard 1474061536524
| status | not learned | measured difficulty | 37% [default] | last interval [days] | |||
|---|---|---|---|---|---|---|---|
| repetition number in this series | 0 | memorised on | scheduled repetition | ||||
| scheduled repetition interval | last repetition or drill |
Parent (intermediate) annotation
Open itPublicly held companies typically include a section in their annual reports where management discusses a variety of issues of concern, including the nature of the business, past results, and future outlook</sp
Original toplevel document
3.1.6. Management Commentary or Management’s Discussion and AnalysisPublicly held companies typically include a section in their annual reports where management discusses a variety of issues of concern, including the nature of the business, past results, and future outlook. This section is referred to by a variety of names, including management report(ing), management commentary, operating and financial review, and management’s discussion and analysis. In
Flashcard 1476399861004
| status | not learned | measured difficulty | 37% [default] | last interval [days] | |||
|---|---|---|---|---|---|---|---|
| repetition number in this series | 0 | memorised on | scheduled repetition | ||||
| scheduled repetition interval | last repetition or drill |
Parent (intermediate) annotation
Open itFor retained earnings, income is the most common increase and a dividend payment is the most common decrease.
Original toplevel document
3.1.3. Statement of Changes in Equitynce, any increases during the period, any decreases during the period, and the ending balance. For paid-in capital, an example of an increase is a new issuance of equity and an example of a decrease is a repurchase of previously issued stock. <span>For retained earnings, income (both net income as reported on the income statement and other comprehensive income) is the most common increase and a dividend payment is the most common decrease. Volkswagen’s balance sheet in Exhibit 3 shows that equity at the end of 2009 totaled €37,430 million, compared with €37,388 million at the end of 2008. The company’s statem
Flashcard 1478131322124
| status | not learned | measured difficulty | 37% [default] | last interval [days] | |||
|---|---|---|---|---|---|---|---|
| repetition number in this series | 0 | memorised on | scheduled repetition | ||||
| scheduled repetition interval | last repetition or drill |
Parent (intermediate) annotation
Open itAn initial trial balance assists in the identification of any adjusting entries that may be required. Once these adjusting entries are made, an adjusted trial balance can be prepared.
Original toplevel document
Open itved and the corresponding liability to deliver newsletters) and, subsequently, 12 future adjusting entries, the first one of which was illustrated as Transaction 12. Each adjusting entry reduces the liability and records revenue. <span>In practice, a large amount of unearned revenue may cause some concern about a company’s ability to deliver on this future commitment. Conversely, a positive aspect is that increases in unearned revenue are an indicator of future revenues. For example, a large liability on the balance sheet of an airline relates to cash received for future airline travel. Revenue will be recognized as the travel occurs, so an increase in this liability is an indicator of future increases in revenue. <span><body><html>
Flashcard 1602268040460
| status | not learned | measured difficulty | 37% [default] | last interval [days] | |||
|---|---|---|---|---|---|---|---|
| repetition number in this series | 0 | memorised on | scheduled repetition | ||||
| scheduled repetition interval | last repetition or drill |
Parent (intermediate) annotation
Open ittion explains why not all potentially dilutive financial instruments actually result in a difference between basic and diluted EPS. 6.3.1. Diluted EPS When a Company Has Convertible Preferred Stock Outstanding <span>When a company has convertible preferred stock outstanding, diluted EPS is calculated using the if-converted method . The if-converted method is based on what EPS would have been if the convertible preferred securities had been converted at the beginning of the period. In other words, the method calcul
Original toplevel document
Earnings Per Shareincome) from continuing operations.46 Similar presentation is required under US GAAP.47 This section outlines the calculations for EPS and explains how the calculation differs for a simple versus complex capital structure. <span>Simple versus Complex Capital Structure A company’s capital is composed of its equity and debt. Some types of equity have preference over others, and some debt (and other instruments) may be converted into equity. Under IFRS, the type of equity for which EPS is presented is referred to as ordinary. Ordinary shares are those equity shares that are subordinate to all other types of equity. The ordinary shareholders are basically the owners of the company—the equity holders who are paid last in a liquidation of the company and who benefit the most when the company does well. Under US GAAP, this ordinary equity is referred to as common stock or common shares , reflecting US language usage. The terms “ordinary shares,” “common stock,” and “common shares” are used interchangeably in the following discussion. When a company has issued any financial instruments that are potentially convertible into common stock, it is said to have a complex capital structure. Examples of financial instruments that are potentially convertible into common stock include convertible bonds, convertible preferred stock, employee stock options, and warrants.48 If a company’s capital structure does not include such potentially convertible financial instruments, it is said to have a simple capital structure. The distinction between simple versus complex capital structure is relevant to the calculation of EPS because financial instruments that are potentially convertible into common stock could, as a result of conversion or exercise, potentially dilute (i.e., decrease) EPS. Information about such a potential dilution is valuable to a company’s current and potential shareholders; therefore, accounting standards require companies to disclose what their EPS would be if all dilutive financial instruments were converted into common stock. The EPS that would result if all dilutive financial instruments were converted is called diluted EPS . In contrast, basic EPS is calculated using the reported earnings available to common shareholders of the parent company and the weighted average number of shares outstanding. Companies are required to report both basic and diluted EPS. For example, Danone reported basic EPS (“before dilution”) and diluted EPS (“after dilution”) of €2.57 for 2009, somewhat lower than 2008. Kraft reported basic EPS of $2.04 and diluted EPS of $2.03 for 2009, much higher than basic and diluted EPS (from continuing operations) of $1.22 and $1.21 for 2008. (The EPS information appears at the bottom of Danone’s and Kraft’s income statements.) An analyst would try to determine the causes underlying the changes in EPS, a topic we will address following an explanation of the calculations of both basic and diluted EPS. <span><body><html>
Flashcard 1602898496780
| status | not learned | measured difficulty | 37% [default] | last interval [days] | |||
|---|---|---|---|---|---|---|---|
| repetition number in this series | 0 | memorised on | scheduled repetition | ||||
| scheduled repetition interval | last repetition or drill |
7. ANALYSIS OF THE INCOME STATEMENT
earnings from discontinued operations, gains or losses from the sale of discontinued operations, and non-recurring income or expenses. Gross Profit Margin equals percent of sales available after deducting cost of goods <span>sold. This percentage is available to cover selling, general and administrative costs, and also earn a profit. It indicates the basic cost structure of a c
earnings from discontinued operations, gains or losses from the sale of discontinued operations, and non-recurring income or expenses. Gross Profit Margin equals percent of sales available after deducting cost of goods <span>sold. This percentage is available to cover selling, general and administrative costs, and also earn a profit. It indicates the basic cost structure of a c
Flashcard 1603190000908
| status | not learned | measured difficulty | 37% [default] | last interval [days] | |||
|---|---|---|---|---|---|---|---|
| repetition number in this series | 0 | memorised on | scheduled repetition | ||||
| scheduled repetition interval | last repetition or drill |
Subject 3. Financial Instruments: Financial Assets and Financial Liabilities
Financial instruments are contracts that give rise to both a financial asset of one company and a financial liability of another company. Financial instruments come in a variety of forms which include derivatives, hedges, and marketable securities. Measured at fair market value: Financial assets:
Financial instruments are contracts that give rise to both a financial asset of one company and a financial liability of another company. Financial instruments come in a variety of forms which include derivatives, hedges, and marketable securities. Measured at fair market value: Financial assets:
Flashcard 1611499441420
| status | not learned | measured difficulty | 37% [default] | last interval [days] | |||
|---|---|---|---|---|---|---|---|
| repetition number in this series | 0 | memorised on | scheduled repetition | ||||
| scheduled repetition interval | last repetition or drill |
Parent (intermediate) annotation
Open itsfy consumer demand. Allocates resources to their most-efficient use; input factors flow from sectors with economic losses to sectors with economic profit, where profit reflects goods most desired by society. Spurs <span>innovation and the development of new technology. Stimulates business investment and economic growth.<span><body><html>
Original toplevel document
3. ANALYSIS OF REVENUE, COSTS, AND PROFITSTotal variable cost divided by quantity; (TVC ÷ Q) Average total cost (ATC) Total cost divided by quantity; (TC ÷ Q) or (AFC + AVC) Marginal cost (MC) Change in total cost divided by change in quantity; (∆TC ÷ ∆Q) <span>3.1. Profit Maximization In free markets—and even in regulated market economies—profit maximization tends to promote economic welfare and a higher standard of living, and creates wealth for investors. Profit motivates businesses to use resources efficiently and to concentrate on activities in which they have a competitive advantage. Most economists believe that profit maximization promotes allocational efficiency—that resources flow into their highest valued uses. Overall, the functions of profit are as follows: Rewards entrepreneurs for risk taking when pursuing business ventures to satisfy consumer demand. Allocates resources to their most-efficient use; input factors flow from sectors with economic losses to sectors with economic profit, where profit reflects goods most desired by society. Spurs innovation and the development of new technology. Stimulates business investment and economic growth. There are three approaches to calculate the point of profit maximization. First, given that profit is the difference between total revenue and total costs, maximum profit occurs at the output level where this difference is the greatest. Second, maximum profit can also be calculated by comparing revenue and cost for each individual unit of output that is produced and sold. A business increases profit through greater sales as long as per-unit revenue exceeds per-unit cost on the next unit of output sold. Profit maximization takes place at the point where the last individual output unit breaks even. Beyond this point, total profit decreases because the per-unit cost is higher than the per-unit revenue from successive output units. A third approach compares the revenue generated by each resource unit with the cost of that unit. Profit contribution occurs when the revenue from an input unit exceeds its cost. The point of profit maximization is reached when resource units no longer contribute to profit. All three approaches yield the same profit-maximizing quantity of output. (These approaches will be explained in greater detail later.) Because profit is the difference between revenue and cost, an understanding of profit maximization requires that we examine both of those components. Revenue comes from the demand for the firm’s products, and cost comes from the acquisition and utilization of the firm’s inputs in the production of those products. 3.1.1. Total, Average, and Marginal Revenue This section briefly examines demand and revenue in preparation for addressing cost. Unless the firm is a pu
Flashcard 1621222624524
| status | not learned | measured difficulty | 37% [default] | last interval [days] | |||
|---|---|---|---|---|---|---|---|
| repetition number in this series | 0 | memorised on | scheduled repetition | ||||
| scheduled repetition interval | last repetition or drill |
Parent (intermediate) annotation
Open itFailing to earn normal profits over the long run has a debilitating impact on the firm’s ability to access capital and to function properly as a business enterprise.
Original toplevel document
2. OBJECTIVES OF THE FIRMquence, the spot price has dramatically increased by 44.3 percent. Economic rent has resulted from this market relationship of a relatively fixed supply of gold and a rising demand for it. <span>2.2. Comparison of Profit Measures All three types of profit are interconnected because, according to Equation 4, accounting profit is the summation of normal and economic profit. In the short run, the normal profit rate is relatively stable, which makes accounting and economic profit the two variable terms in the profit equation. Over the longer term, all three types of profit are variable, where the normal profit rate can change according to investment returns across firms in the industry. Normal profit is necessary to stay in business in the long run; positive economic profit is not. A business can survive indefinitely by just making the normal profit return for investors. Failing to earn normal profits over the long run has a debilitating impact on the firm’s ability to access capital and to function properly as a business enterprise. Consequentially, the market value of equity and shareholders’ wealth deteriorates whenever risk to achieving normal profit materializes and the firm fails to reward investors for their risk exposure and for the opportunity cost of their equity capital. To summarize, the ultimate goal of analyzing the different types of profit is to determine how their relationships to one another influence the firm’s market value of equity. Exhibit 2 compares accounting, normal, and economic profits in terms of how a firm’s market value of equity is impacted by the relationships among the three types of profit. Exhibit 2. Relationship of Accounting, Normal, and Economic Profit to Equity Value Relationship between Accounting Profit and Normal Profit Economic Profit Firm’s Market Value of Equity Accounting profit > Normal profit Economic profit > 0 and firm is able to protect economic profit over the long run Positive effect Accounting profit = Normal profit Economic profit = 0 No effect Accounting profit < Normal profit Economic profit < 0 implies economic loss Negative effect <span><body><html>
| status | not read | reprioritisations | ||
|---|---|---|---|---|
| last reprioritisation on | suggested re-reading day | |||
| started reading on | finished reading on |
Flashcard 1715286445324
| status | not learned | measured difficulty | 37% [default] | last interval [days] | |||
|---|---|---|---|---|---|---|---|
| repetition number in this series | 0 | memorised on | scheduled repetition | ||||
| scheduled repetition interval | last repetition or drill |
Temer e aliados avaliam que base encolheu, cobram PSDB e já traçam estratégias para 2018 | Blog da Andréia Sadi | G1
3 Atualizado há 1 hora O presidente Michel Temer reuniu na noite desta terça-feira (12), no Palácio do Planalto, o ministro da Casa Civil, Eliseu Padilha, e o presidente da Câmara, Rodrigo Maia (DEM-RJ), <span>para uma avaliação realista sobre a possibilidade de votação da reforma da Previdência na semana que vem. Segundo o Blog apurou, a avaliação dos governistas que participaram da reunião foi a de que a base aliada "encolheu" após a votação das duas denúncias contra o pres
3 Atualizado há 1 hora O presidente Michel Temer reuniu na noite desta terça-feira (12), no Palácio do Planalto, o ministro da Casa Civil, Eliseu Padilha, e o presidente da Câmara, Rodrigo Maia (DEM-RJ), <span>para uma avaliação realista sobre a possibilidade de votação da reforma da Previdência na semana que vem. Segundo o Blog apurou, a avaliação dos governistas que participaram da reunião foi a de que a base aliada "encolheu" após a votação das duas denúncias contra o pres
Flashcard 1715311086860
| status | not learned | measured difficulty | 37% [default] | last interval [days] | |||
|---|---|---|---|---|---|---|---|
| repetition number in this series | 0 | memorised on | scheduled repetition | ||||
| scheduled repetition interval | last repetition or drill |
Parent (intermediate) annotation
Open its launched, which claimed to show that all or practically all pre-Islamic poetry had been forged in Islamic times. The call to battle was sounded simultaneously yet independently by the Egyptian scholar Taha Husain and the British Orientalist <span>D. S. Margoliouth. The former cut the Gordian knot by the publication of his book Fi sh-shi'r al-jdhili ('On Pre-Islamic Poetry'),2 and two years later he summed up his position that the general mass of w
Original toplevel document (pdf)
cannot see any pdfsFlashcard 1715323145484
| status | not learned | measured difficulty | 37% [default] | last interval [days] | |||
|---|---|---|---|---|---|---|---|
| repetition number in this series | 0 | memorised on | scheduled repetition | ||||
| scheduled repetition interval | last repetition or drill |
Wikipédia, l'encyclopédie libre
ut améliorer Version pour appareil mobile Wikipédia en bref Principes fondateurs Portails thématiques Accueil de la communauté Comment contribuer ? Poser une question Article labellisé du jour [imagelink] <span>L'abbaye Saint-Paul de Cormery est une ancienne abbaye bénédictine située sur la commune de Cormery dans le département d'Indre-et-Loire, en France. Simple fondation monastique d'Ithier en 791, elle se voit dotée par Alcuin en 800 du statut d'abbaye et adopte la règle de saint Benoît. Elle est dès lors rattachée à l'abbaye de Sai
ut améliorer Version pour appareil mobile Wikipédia en bref Principes fondateurs Portails thématiques Accueil de la communauté Comment contribuer ? Poser une question Article labellisé du jour [imagelink] <span>L'abbaye Saint-Paul de Cormery est une ancienne abbaye bénédictine située sur la commune de Cormery dans le département d'Indre-et-Loire, en France. Simple fondation monastique d'Ithier en 791, elle se voit dotée par Alcuin en 800 du statut d'abbaye et adopte la règle de saint Benoît. Elle est dès lors rattachée à l'abbaye de Sai
Flashcard 1715325766924
| status | not learned | measured difficulty | 37% [default] | last interval [days] | |||
|---|---|---|---|---|---|---|---|
| repetition number in this series | 0 | memorised on | scheduled repetition | ||||
| scheduled repetition interval | last repetition or drill |
Wikipédia, l'encyclopédie libre
bbaye de Saint-Martin à Tours et le reste jusqu'à sa fermeture. Malgré des dommages causés par les Normands dans la seconde moitié du IX e siècle, l'abbaye se développe rapidement — et autour d'elle le bourg de Cormery. Au milieu du Moyen Âg<span>e, elle compte de nombreuses possessions dans plusieurs provinces françaises et ses bateaux peuvent naviguer librement sur tous les cours d'eau du royaume ; c'est alors l'une des plus puissantes abbayes tourangelles. Elle connaît par la suite des jours plus difficiles
bbaye de Saint-Martin à Tours et le reste jusqu'à sa fermeture. Malgré des dommages causés par les Normands dans la seconde moitié du IX e siècle, l'abbaye se développe rapidement — et autour d'elle le bourg de Cormery. Au milieu du Moyen Âg<span>e, elle compte de nombreuses possessions dans plusieurs provinces françaises et ses bateaux peuvent naviguer librement sur tous les cours d'eau du royaume ; c'est alors l'une des plus puissantes abbayes tourangelles. Elle connaît par la suite des jours plus difficiles
| status | not read | reprioritisations | ||
|---|---|---|---|---|
| last reprioritisation on | suggested re-reading day | |||
| started reading on | finished reading on |
Wikipédia, l'encyclopédie libre
ut améliorer Version pour appareil mobile Wikipédia en bref Principes fondateurs Portails thématiques Accueil de la communauté Comment contribuer ? Poser une question Article labellisé du jour [imagelink] <span>L'abbaye Saint-Paul de Cormery est une ancienne abbaye bénédictine située sur la commune de Cormery dans le département d'Indre-et-Loire, en France. Simple fondation monastique d'Ithier en 791, elle se voit dotée par Alcuin en 800 du statut d'abbaye et adopte la règle de saint Benoît. Elle est dès lors rattachée à l'abbaye de Sain
| status | not read | reprioritisations | ||
|---|---|---|---|---|
| last reprioritisation on | suggested re-reading day | |||
| started reading on | finished reading on |
Unknown title
y of Leuven, Belgium, this very question came up. I think I gave an adequate answer to the question, but I also realised that the full answer is probably not something that fits easily in a Q&A session after a lecture. Hence, this post! <span>The short answer: It’s better to cover large volumes of easy material The short answer is that you should probably focus more on extensive studying than you are currently doing. I’m saying this both because it’s generally speaking a better approach, and because I know that most courses don’t do this even remotely as much as they should. Read more in this article: The illusion of advanced learning and what to do about it There are also many requirements that have to be met in order for deep-end immersion to be a good idea, but more about that later. Extensive studying To make sure we’re on the same page, the idea behind extensive studying is that you cover much more content in a given amount of time, which you can do because th


![[imagelink]](/bubo5/browser?url=http%3A//www.hackingchinese.com/wp-content/uploads/2015/08/Picture6.png)
![[imagelink]](/bubo5/browser?url=http%3A//www.hackingchinese.com/wp-content/uploads/2015/08/Picture7.png)
| status | not read | reprioritisations | ||
|---|---|---|---|---|
| last reprioritisation on | suggested re-reading day | |||
| started reading on | finished reading on |
| status | not read | reprioritisations | ||
|---|---|---|---|---|
| last reprioritisation on | suggested re-reading day | |||
| started reading on | finished reading on |
Unknown title
much as they should. Read more in this article: The illusion of advanced learning and what to do about it There are also many requirements that have to be met in order for deep-end immersion to be a good idea, but more about that later. <span>Extensive studying To make sure we’re on the same page, the idea behind extensive studying is that you cover much more content in a given amount of time, which you can do because the difficulty is much lower. Compare reading the next chapter in your textbook (which will contain things you don’t know) to reading text based almost entirely on things you already know. The latter is several ti