Edited, memorised or added to reading queue
on 17-Dec-2018 (Mon)
Do you want BuboFlash to help you learning these things? Click here to log in or create user.
Flashcard 1611287366924
| status | not learned | measured difficulty | 37% [default] | last interval [days] | |||
|---|---|---|---|---|---|---|---|
| repetition number in this series | 0 | memorised on | scheduled repetition | ||||
| scheduled repetition interval | last repetition or drill |
Subject 5. Uses and Analysis of the Balance Sheet
Balance Sheet Ratios Liquidity ratios measure the ability of a company to meet future short-term financial obligations from current assets and, more importantly, cash flows. Each of the following ratios takes a slightly different view of cash or near-cash items. Current Ratio is a measure of the number of dollars of current assets available to
Balance Sheet Ratios Liquidity ratios measure the ability of a company to meet future short-term financial obligations from current assets and, more importantly, cash flows. Each of the following ratios takes a slightly different view of cash or near-cash items. Current Ratio is a measure of the number of dollars of current assets available to
Flashcard 1611290512652
| status | not learned | measured difficulty | 37% [default] | last interval [days] | |||
|---|---|---|---|---|---|---|---|
| repetition number in this series | 0 | memorised on | scheduled repetition | ||||
| scheduled repetition interval | last repetition or drill |
Subject 5. Uses and Analysis of the Balance Sheet
tios measure the ability of a company to meet future short-term financial obligations from current assets and, more importantly, cash flows. Each of the following ratios takes a slightly different view of cash or near-cash items. <span>Current Ratio is a measure of the number of dollars of current assets available to meet current obligations. It is the best-known liquidity measure. A current ratio of less than 1 indicates the company has negative working capital. Quick Rati
tios measure the ability of a company to meet future short-term financial obligations from current assets and, more importantly, cash flows. Each of the following ratios takes a slightly different view of cash or near-cash items. <span>Current Ratio is a measure of the number of dollars of current assets available to meet current obligations. It is the best-known liquidity measure. A current ratio of less than 1 indicates the company has negative working capital. Quick Rati
Flashcard 1611295231244
| status | not learned | measured difficulty | 37% [default] | last interval [days] | |||
|---|---|---|---|---|---|---|---|
| repetition number in this series | 0 | memorised on | scheduled repetition | ||||
| scheduled repetition interval | last repetition or drill |
Subject 5. Uses and Analysis of the Balance Sheet
the following ratios takes a slightly different view of cash or near-cash items. Current Ratio is a measure of the number of dollars of current assets available to meet current obligations. It is the best-known liquidity measure. <span>A current ratio of less than 1 indicates the company has negative working capital. Quick Ratio (Acid-Test Ratio) eliminates less liquid assets, such as inventory and pre-paid expenses, from the current ratio. If inve
the following ratios takes a slightly different view of cash or near-cash items. Current Ratio is a measure of the number of dollars of current assets available to meet current obligations. It is the best-known liquidity measure. <span>A current ratio of less than 1 indicates the company has negative working capital. Quick Ratio (Acid-Test Ratio) eliminates less liquid assets, such as inventory and pre-paid expenses, from the current ratio. If inve
Flashcard 1611305454860
| status | not learned | measured difficulty | 37% [default] | last interval [days] | |||
|---|---|---|---|---|---|---|---|
| repetition number in this series | 0 | memorised on | scheduled repetition | ||||
| scheduled repetition interval | last repetition or drill |
Subject 5. Uses and Analysis of the Balance Sheet
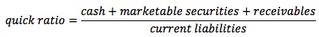
of dollars of current assets available to meet current obligations. It is the best-known liquidity measure. A current ratio of less than 1 indicates the company has negative working capital. <span>Quick Ratio (Acid-Test Ratio) eliminates less liquid assets, such as inventory and pre-paid expenses, from the current ratio. If inventory is not moving, the quick ratio is a better indicator of cash and near-cash items that will be available to meet current obligations. Cash Ratio is the most conservative liquidity ratio, determined by eliminating receivables from the quick ratio. As with the elimination of
of dollars of current assets available to meet current obligations. It is the best-known liquidity measure. A current ratio of less than 1 indicates the company has negative working capital. <span>Quick Ratio (Acid-Test Ratio) eliminates less liquid assets, such as inventory and pre-paid expenses, from the current ratio. If inventory is not moving, the quick ratio is a better indicator of cash and near-cash items that will be available to meet current obligations. Cash Ratio is the most conservative liquidity ratio, determined by eliminating receivables from the quick ratio. As with the elimination of
Flashcard 1611308600588
| status | not learned | measured difficulty | 37% [default] | last interval [days] | |||
|---|---|---|---|---|---|---|---|
| repetition number in this series | 0 | memorised on | scheduled repetition | ||||
| scheduled repetition interval | last repetition or drill |
Subject 5. Uses and Analysis of the Balance Sheet
ory and pre-paid expenses, from the current ratio. If inventory is not moving, the quick ratio is a better indicator of cash and near-cash items that will be available to meet current obligations. <span>Cash Ratio is the most conservative liquidity ratio, determined by eliminating receivables from the quick ratio. As with the elimination of inventory in the quick ratio, there is no guarantee that the receivables will be collected.
ory and pre-paid expenses, from the current ratio. If inventory is not moving, the quick ratio is a better indicator of cash and near-cash items that will be available to meet current obligations. <span>Cash Ratio is the most conservative liquidity ratio, determined by eliminating receivables from the quick ratio. As with the elimination of inventory in the quick ratio, there is no guarantee that the receivables will be collected.
Flashcard 1611318037772
| status | not learned | measured difficulty | 37% [default] | last interval [days] | |||
|---|---|---|---|---|---|---|---|
| repetition number in this series | 0 | memorised on | scheduled repetition | ||||
| scheduled repetition interval | last repetition or drill |
Subject 5. Uses and Analysis of the Balance Sheet
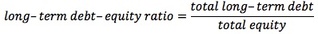
13; Solvency ratios measure a company's ability to meet long-term and other obligations. Long-Term Debt-Equity Ratio is an indicator of the degree of protection available to the creditors in the event of insolvency of a company. <span>Higher debt-equity ratio indicates higher financial risk. Debt-Equity Ratio includes short-term debt in the numerator. The total debt inclu
13; Solvency ratios measure a company's ability to meet long-term and other obligations. Long-Term Debt-Equity Ratio is an indicator of the degree of protection available to the creditors in the event of insolvency of a company. <span>Higher debt-equity ratio indicates higher financial risk. Debt-Equity Ratio includes short-term debt in the numerator. The total debt inclu
Flashcard 1611320397068
| status | not learned | measured difficulty | 37% [default] | last interval [days] | |||
|---|---|---|---|---|---|---|---|
| repetition number in this series | 0 | memorised on | scheduled repetition | ||||
| scheduled repetition interval | last repetition or drill |
Subject 5. Uses and Analysis of the Balance Sheet
ory in the quick ratio, there is no guarantee that the receivables will be collected. Solvency ratios measure a company's ability to meet long-term and other obligations. <span>Long-Term Debt-Equity Ratio is an indicator of the degree of protection available to the creditors in the event of insolvency of a company. Higher debt-equity ratio indicates higher financial risk. Debt-Equity Ratio includes short-term debt in the numerator. The total debt inclu
ory in the quick ratio, there is no guarantee that the receivables will be collected. Solvency ratios measure a company's ability to meet long-term and other obligations. <span>Long-Term Debt-Equity Ratio is an indicator of the degree of protection available to the creditors in the event of insolvency of a company. Higher debt-equity ratio indicates higher financial risk. Debt-Equity Ratio includes short-term debt in the numerator. The total debt inclu
Flashcard 1611322756364
| status | not learned | measured difficulty | 37% [default] | last interval [days] | |||
|---|---|---|---|---|---|---|---|
| repetition number in this series | 0 | memorised on | scheduled repetition | ||||
| scheduled repetition interval | last repetition or drill |
Subject 5. Uses and Analysis of the Balance Sheet
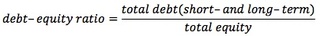
rm Debt-Equity Ratio is an indicator of the degree of protection available to the creditors in the event of insolvency of a company. Higher debt-equity ratio indicates higher financial risk. <span>Debt-Equity Ratio includes short-term debt in the numerator. The total debt includes all liabilities, including non-interest-bearing debt such as accounts payables, accrued expenses, and deferre
rm Debt-Equity Ratio is an indicator of the degree of protection available to the creditors in the event of insolvency of a company. Higher debt-equity ratio indicates higher financial risk. <span>Debt-Equity Ratio includes short-term debt in the numerator. The total debt includes all liabilities, including non-interest-bearing debt such as accounts payables, accrued expenses, and deferre
Flashcard 1611325115660
| status | not learned | measured difficulty | 37% [default] | last interval [days] | |||
|---|---|---|---|---|---|---|---|
| repetition number in this series | 0 | memorised on | scheduled repetition | ||||
| scheduled repetition interval | last repetition or drill |
Subject 5. Uses and Analysis of the Balance Sheet
rm Debt-Equity Ratio is an indicator of the degree of protection available to the creditors in the event of insolvency of a company. Higher debt-equity ratio indicates higher financial risk. <span>Debt-Equity Ratio includes short-term debt in the numerator. The total debt includes all liabilities, including non-interest-bearing debt such as accounts payables, accrued expenses, and deferre
rm Debt-Equity Ratio is an indicator of the degree of protection available to the creditors in the event of insolvency of a company. Higher debt-equity ratio indicates higher financial risk. <span>Debt-Equity Ratio includes short-term debt in the numerator. The total debt includes all liabilities, including non-interest-bearing debt such as accounts payables, accrued expenses, and deferre
Flashcard 1611329834252

| status | not learned | measured difficulty | 37% [default] | last interval [days] | |||
|---|---|---|---|---|---|---|---|
| repetition number in this series | 0 | memorised on | scheduled repetition | ||||
| scheduled repetition interval | last repetition or drill |
Subject 5. Uses and Analysis of the Balance Sheet
ilities, including non-interest-bearing debt such as accounts payables, accrued expenses, and deferred taxes. This ratio is especially useful in analyzing a company with substantial financing from short-term borrowing. <span>Total Debt Ratio = Financial Leverage Ratio = Financial statement analysis aims to investigate a company's financial condition and operating performance. Using financial rati
ilities, including non-interest-bearing debt such as accounts payables, accrued expenses, and deferred taxes. This ratio is especially useful in analyzing a company with substantial financing from short-term borrowing. <span>Total Debt Ratio = Financial Leverage Ratio = Financial statement analysis aims to investigate a company's financial condition and operating performance. Using financial rati
Flashcard 1611332193548

| status | not learned | measured difficulty | 37% [default] | last interval [days] | |||
|---|---|---|---|---|---|---|---|
| repetition number in this series | 0 | memorised on | scheduled repetition | ||||
| scheduled repetition interval | last repetition or drill |
Subject 5. Uses and Analysis of the Balance Sheet
ing debt such as accounts payables, accrued expenses, and deferred taxes. This ratio is especially useful in analyzing a company with substantial financing from short-term borrowing. Total Debt Ratio = <span>Financial Leverage Ratio = Financial statement analysis aims to investigate a company's financial condition and operating performance. Using financial ratios helps to examine relationships among indi
ing debt such as accounts payables, accrued expenses, and deferred taxes. This ratio is especially useful in analyzing a company with substantial financing from short-term borrowing. Total Debt Ratio = <span>Financial Leverage Ratio = Financial statement analysis aims to investigate a company's financial condition and operating performance. Using financial ratios helps to examine relationships among indi
Flashcard 1612732304652
| status | not learned | measured difficulty | 37% [default] | last interval [days] | |||
|---|---|---|---|---|---|---|---|
| repetition number in this series | 0 | memorised on | scheduled repetition | ||||
| scheduled repetition interval | last repetition or drill |
Subject 5. Uses and Analysis of the Balance Sheet
the following ratios takes a slightly different view of cash or near-cash items. Current Ratio is a measure of the number of dollars of current assets available to meet current obligations. It is the best-known liquidity measure. <span>A current ratio of less than 1 indicates the company has negative working capital. Quick Ratio (Acid-Test Ratio) eliminates less liquid assets, such as inventory and pre-paid expenses, from the current ratio. If inve
the following ratios takes a slightly different view of cash or near-cash items. Current Ratio is a measure of the number of dollars of current assets available to meet current obligations. It is the best-known liquidity measure. <span>A current ratio of less than 1 indicates the company has negative working capital. Quick Ratio (Acid-Test Ratio) eliminates less liquid assets, such as inventory and pre-paid expenses, from the current ratio. If inve
Flashcard 1621333773580
| status | not learned | measured difficulty | 37% [default] | last interval [days] | |||
|---|---|---|---|---|---|---|---|
| repetition number in this series | 0 | memorised on | scheduled repetition | ||||
| scheduled repetition interval | last repetition or drill |
Open it
The nominal risk-free rate of return includes both the real risk-free rate of return and the expected rate of inflation. A decrease in expected inflation rate would decrease the nominal risk-free rate of return, but would have no effect on the real risk-free rate of return.
Flashcard 1621336132876
| status | not learned | measured difficulty | 37% [default] | last interval [days] | |||
|---|---|---|---|---|---|---|---|
| repetition number in this series | 0 | memorised on | scheduled repetition | ||||
| scheduled repetition interval | last repetition or drill |
Open it
The nominal risk-free rate of return includes both the real risk-free rate of return and the expected rate of inflation. A decrease in expected inflation rate would decrease the nominal risk-free rate of return, but would have no effect on the real risk-free rate of return.
Flashcard 1621372046604
| status | not learned | measured difficulty | 37% [default] | last interval [days] | |||
|---|---|---|---|---|---|---|---|
| repetition number in this series | 0 | memorised on | scheduled repetition | ||||
| scheduled repetition interval | last repetition or drill |
Flashcard 1621380435212
| status | not learned | measured difficulty | 37% [default] | last interval [days] | |||
|---|---|---|---|---|---|---|---|
| repetition number in this series | 0 | memorised on | scheduled repetition | ||||
| scheduled repetition interval | last repetition or drill |
Flashcard 1621382270220
| status | not learned | measured difficulty | 37% [default] | last interval [days] | |||
|---|---|---|---|---|---|---|---|
| repetition number in this series | 0 | memorised on | scheduled repetition | ||||
| scheduled repetition interval | last repetition or drill |
Flashcard 1621384891660
| status | not learned | measured difficulty | 37% [default] | last interval [days] | |||
|---|---|---|---|---|---|---|---|
| repetition number in this series | 0 | memorised on | scheduled repetition | ||||
| scheduled repetition interval | last repetition or drill |
Flashcard 1621395901708
| status | not learned | measured difficulty | 37% [default] | last interval [days] | |||
|---|---|---|---|---|---|---|---|
| repetition number in this series | 0 | memorised on | scheduled repetition | ||||
| scheduled repetition interval | last repetition or drill |
Flashcard 1621399571724
| status | not learned | measured difficulty | 37% [default] | last interval [days] | |||
|---|---|---|---|---|---|---|---|
| repetition number in this series | 0 | memorised on | scheduled repetition | ||||
| scheduled repetition interval | last repetition or drill |
Flashcard 1621401406732
| status | not learned | measured difficulty | 37% [default] | last interval [days] | |||
|---|---|---|---|---|---|---|---|
| repetition number in this series | 0 | memorised on | scheduled repetition | ||||
| scheduled repetition interval | last repetition or drill |
Flashcard 1621405863180
| status | not learned | measured difficulty | 37% [default] | last interval [days] | |||
|---|---|---|---|---|---|---|---|
| repetition number in this series | 0 | memorised on | scheduled repetition | ||||
| scheduled repetition interval | last repetition or drill |
Flashcard 1621407698188
| status | not learned | measured difficulty | 37% [default] | last interval [days] | |||
|---|---|---|---|---|---|---|---|
| repetition number in this series | 0 | memorised on | scheduled repetition | ||||
| scheduled repetition interval | last repetition or drill |
Flashcard 1621409533196
| status | not learned | measured difficulty | 37% [default] | last interval [days] | |||
|---|---|---|---|---|---|---|---|
| repetition number in this series | 0 | memorised on | scheduled repetition | ||||
| scheduled repetition interval | last repetition or drill |
Flashcard 1621439941900
| status | not learned | measured difficulty | 37% [default] | last interval [days] | |||
|---|---|---|---|---|---|---|---|
| repetition number in this series | 0 | memorised on | scheduled repetition | ||||
| scheduled repetition interval | last repetition or drill |
Open it
The nominal risk-free rate of return includes both the real risk-free rate of return and the expected rate of inflation. A decrease in expected inflation rate would decrease the nominal risk-free rate of return, but would have no effect on the real risk-free rate of return.
Flashcard 1621961870604
| status | not learned | measured difficulty | 37% [default] | last interval [days] | |||
|---|---|---|---|---|---|---|---|
| repetition number in this series | 0 | memorised on | scheduled repetition | ||||
| scheduled repetition interval | last repetition or drill |
Parent (intermediate) annotation
Open itExhibit 2. Common Accounts Assets Cash and cash equivalents Accounts receivable, trade receivables Prepaid expenses Inventory Property, plant, and equipment Investment propert
Original toplevel document
3.1. Financial Statement Elements and Accountsounting periods), and sales returns and allowances (an offset to revenue reflecting any cash refunds, credits on account, and discounts from sales prices given to customers who purchased defective or unsatisfactory items). <span>Exhibit 2. Common Accounts Assets Cash and cash equivalents Accounts receivable, trade receivables Prepaid expenses Inventory Property, plant, and equipment Investment property Intangible assets (patents, trademarks, licenses, copyright, goodwill) Financial assets, trading securities, investment securities Investments accounted for by the equity method Current and deferred tax assets [for banks, Loans (receivable)] Liabilities Accounts payable, trade payables Provisions or accrued liabilities Financial liabilities Current and deferred tax liabilities Reserves Unearned revenue Debt payable Bonds (payable) [for banks, Deposits] Owners’ Equity Capital, such as common stock par value Additional paid-in capital Retained earnings Other comprehensive income Minority interest Revenue Revenue, sales Gains Investment income (e.g., interest and dividends) Expense Cost of goods sold Selling, general, and administrative expenses “SG&A” (e.g., rent, utilities, salaries, advertising) Depreciation and amortization Interest expense Tax expense Losses For presentation purposes, assets are sometimes categorized as “current” or “non-current.” For example, Tesco (a large European retailer) prese
Flashcard 1621978123532
| status | not learned | measured difficulty | 37% [default] | last interval [days] | |||
|---|---|---|---|---|---|---|---|
| repetition number in this series | 0 | memorised on | scheduled repetition | ||||
| scheduled repetition interval | last repetition or drill |
Flashcard 1621979958540
| status | not learned | measured difficulty | 37% [default] | last interval [days] | |||
|---|---|---|---|---|---|---|---|
| repetition number in this series | 0 | memorised on | scheduled repetition | ||||
| scheduled repetition interval | last repetition or drill |
Flashcard 1621981793548
| status | not learned | measured difficulty | 37% [default] | last interval [days] | |||
|---|---|---|---|---|---|---|---|
| repetition number in this series | 0 | memorised on | scheduled repetition | ||||
| scheduled repetition interval | last repetition or drill |
Flashcard 1621984677132
| status | not learned | measured difficulty | 37% [default] | last interval [days] | |||
|---|---|---|---|---|---|---|---|
| repetition number in this series | 0 | memorised on | scheduled repetition | ||||
| scheduled repetition interval | last repetition or drill |
Flashcard 1621989395724
| status | not learned | measured difficulty | 37% [default] | last interval [days] | |||
|---|---|---|---|---|---|---|---|
| repetition number in this series | 0 | memorised on | scheduled repetition | ||||
| scheduled repetition interval | last repetition or drill |
Flashcard 1621992803596
| status | not learned | measured difficulty | 37% [default] | last interval [days] | |||
|---|---|---|---|---|---|---|---|
| repetition number in this series | 0 | memorised on | scheduled repetition | ||||
| scheduled repetition interval | last repetition or drill |
Flashcard 1621996473612
| status | not learned | measured difficulty | 37% [default] | last interval [days] | |||
|---|---|---|---|---|---|---|---|
| repetition number in this series | 0 | memorised on | scheduled repetition | ||||
| scheduled repetition interval | last repetition or drill |
Flashcard 1621998308620
| status | not learned | measured difficulty | 37% [default] | last interval [days] | |||
|---|---|---|---|---|---|---|---|
| repetition number in this series | 0 | memorised on | scheduled repetition | ||||
| scheduled repetition interval | last repetition or drill |
Flashcard 1622000143628
| status | not learned | measured difficulty | 37% [default] | last interval [days] | |||
|---|---|---|---|---|---|---|---|
| repetition number in this series | 0 | memorised on | scheduled repetition | ||||
| scheduled repetition interval | last repetition or drill |
Flashcard 1622004862220
| status | not learned | measured difficulty | 37% [default] | last interval [days] | |||
|---|---|---|---|---|---|---|---|
| repetition number in this series | 0 | memorised on | scheduled repetition | ||||
| scheduled repetition interval | last repetition or drill |
Flashcard 1622006172940
| status | not learned | measured difficulty | 37% [default] | last interval [days] | |||
|---|---|---|---|---|---|---|---|
| repetition number in this series | 0 | memorised on | scheduled repetition | ||||
| scheduled repetition interval | last repetition or drill |
Flashcard 1622010629388
| status | not learned | measured difficulty | 37% [default] | last interval [days] | |||
|---|---|---|---|---|---|---|---|
| repetition number in this series | 0 | memorised on | scheduled repetition | ||||
| scheduled repetition interval | last repetition or drill |
Flashcard 1622020853004
| status | not learned | measured difficulty | 37% [default] | last interval [days] | |||
|---|---|---|---|---|---|---|---|
| repetition number in this series | 0 | memorised on | scheduled repetition | ||||
| scheduled repetition interval | last repetition or drill |
Flashcard 1622234762508
| status | not learned | measured difficulty | 37% [default] | last interval [days] | |||
|---|---|---|---|---|---|---|---|
| repetition number in this series | 0 | memorised on | scheduled repetition | ||||
| scheduled repetition interval | last repetition or drill |
Flashcard 1622722088204
| status | not learned | measured difficulty | 37% [default] | last interval [days] | |||
|---|---|---|---|---|---|---|---|
| repetition number in this series | 0 | memorised on | scheduled repetition | ||||
| scheduled repetition interval | last repetition or drill |
Flashcard 1622724709644
| status | not learned | measured difficulty | 37% [default] | last interval [days] | |||
|---|---|---|---|---|---|---|---|
| repetition number in this series | 0 | memorised on | scheduled repetition | ||||
| scheduled repetition interval | last repetition or drill |
Flashcard 1622726544652
| status | not learned | measured difficulty | 37% [default] | last interval [days] | |||
|---|---|---|---|---|---|---|---|
| repetition number in this series | 0 | memorised on | scheduled repetition | ||||
| scheduled repetition interval | last repetition or drill |
Flashcard 1622876491020
| status | not learned | measured difficulty | 37% [default] | last interval [days] | |||
|---|---|---|---|---|---|---|---|
| repetition number in this series | 0 | memorised on | scheduled repetition | ||||
| scheduled repetition interval | last repetition or drill |
Rule of 72
To quickly approximate the number of periods, practitioners sometimes use an ad hoc rule called the Rule of 72 : Divide 72 by the stated interest rate to get the approximate number of years it would take to double an investment at the interest rate. Here, the approximation gives 72/7 = 10.3 year
Flashcard 1622881471756
| status | not learned | measured difficulty | 37% [default] | last interval [days] | |||
|---|---|---|---|---|---|---|---|
| repetition number in this series | 0 | memorised on | scheduled repetition | ||||
| scheduled repetition interval | last repetition or drill |
Flashcard 1622889336076
| status | not learned | measured difficulty | 37% [default] | last interval [days] | |||
|---|---|---|---|---|---|---|---|
| repetition number in this series | 0 | memorised on | scheduled repetition | ||||
| scheduled repetition interval | last repetition or drill |
Open it
compensate lenders for risk: an inflation premium, a default risk premium, a liquidity premium, and a maturity premium. The future value, FV, is the present value, PV, times the future value factor, (1 + r) N . <span>The interest rate, r, makes current and future currency amounts equivalent based on their time value. The stated annual interest rate is a quoted interest rate that does not account for compounding within the year. The periodic rate is the quoted interest
Flashcard 1622891957516
| status | not learned | measured difficulty | 37% [default] | last interval [days] | |||
|---|---|---|---|---|---|---|---|
| repetition number in this series | 0 | memorised on | scheduled repetition | ||||
| scheduled repetition interval | last repetition or drill |
Open it
s per year. The effective annual rate is the amount by which a unit of currency will grow in a year with interest on interest included. An annuity is a finite set of level sequential cash flows. <span>There are two types of annuities, the annuity due and the ordinary annuity. The annuity due has a first cash flow that occurs immediately; the ordinary annuity has a first cash flow that occurs one period from the present (indexed at t = 1). On
Flashcard 1624091004172
| status | not learned | measured difficulty | 37% [default] | last interval [days] | |||
|---|---|---|---|---|---|---|---|
| repetition number in this series | 0 | memorised on | scheduled repetition | ||||
| scheduled repetition interval | last repetition or drill |
Parent (intermediate) annotation
Open itThe present value of a perpetuity is A/r, where A is the periodic payment to be received forever.
Original toplevel document
Open itmay be handled in a similar fashion as single payments if we use annuity factors instead of single-payment factors. The present value, PV, is the future value, FV, times the present value factor, (1 + r) − N . <span>The present value of a perpetuity is A/r, where A is the periodic payment to be received forever. It is possible to calculate an unknown variable, given the other relevant variables in time value of money problems. The cash flow additivity principle c
Flashcard 1634536656140
| status | not learned | measured difficulty | 37% [default] | last interval [days] | |||
|---|---|---|---|---|---|---|---|
| repetition number in this series | 0 | memorised on | scheduled repetition | ||||
| scheduled repetition interval | last repetition or drill |
Flashcard 1635165277452
| status | not learned | measured difficulty | 37% [default] | last interval [days] | |||
|---|---|---|---|---|---|---|---|
| repetition number in this series | 0 | memorised on | scheduled repetition | ||||
| scheduled repetition interval | last repetition or drill |
Subject 1. The Nature of Statistics
btained if they were taught with this method. Both large groups of data (populations) and smaller groups (samples) have values associated with them, such as the average of all values in a sample and the average of all population values. <span>Values from a population are called parameters, and values from a sample are called statistics. A parameter is a numerical quantity measuring some aspect of a population of scores. The mean, for example, is a measure of central tendency. Greek letters are
Flashcard 1635167636748
| status | not learned | measured difficulty | 37% [default] | last interval [days] | |||
|---|---|---|---|---|---|---|---|
| repetition number in this series | 0 | memorised on | scheduled repetition | ||||
| scheduled repetition interval | last repetition or drill |
Subject 1. The Nature of Statistics
tion are called parameters, and values from a sample are called statistics. A parameter is a numerical quantity measuring some aspect of a population of scores. The mean, for example, is a measure of central tendency. <span>Greek letters are used to designate parameters. Parameters are rarely known and are usually estimated by statistics computed in samples. Populations can have many parameters, but investment analysts are usually only concerned with a
Flashcard 1635388361996
| status | not learned | measured difficulty | 37% [default] | last interval [days] | |||
|---|---|---|---|---|---|---|---|
| repetition number in this series | 0 | memorised on | scheduled repetition | ||||
| scheduled repetition interval | last repetition or drill |
Subject 2. Measurement Scales
systematic fashion. To choose the appropriate statistical methods for summarizing and analyzing data, we need to distinguish between different measurement scales or levels of measurement. Nominal Scale <span>Nominal measurement represents the weakest level of measurement. It consists of assigning items to groups or categories. No quantitative information is conveyed and no ordering (ranking) of the items is implied. Nominal scales are qualitative rather
Flashcard 1635390721292
| status | not learned | measured difficulty | 37% [default] | last interval [days] | |||
|---|---|---|---|---|---|---|---|
| repetition number in this series | 0 | memorised on | scheduled repetition | ||||
| scheduled repetition interval | last repetition or drill |
Subject 2. Measurement Scales
or summarizing and analyzing data, we need to distinguish between different measurement scales or levels of measurement. Nominal Scale Nominal measurement represents the weakest level of measurement. It <span>consists of assigning items to groups or categories. No quantitative information is conveyed and no ordering (ranking) of the items is implied. Nominal scales are qualitative rather than quantitative. Religious preference, r
Flashcard 1635395702028
| status | not learned | measured difficulty | 37% [default] | last interval [days] | |||
|---|---|---|---|---|---|---|---|
| repetition number in this series | 0 | memorised on | scheduled repetition | ||||
| scheduled repetition interval | last repetition or drill |
Subject 2. Measurement Scales
3; Nominal Scale Nominal measurement represents the weakest level of measurement. It consists of assigning items to groups or categories. No quantitative information is conveyed and no ordering (ranking) of the items is implied. <span>Nominal scales are qualitative rather than quantitative. Religious preference, race, and sex are all examples of nominal scales. Another example is portfolio managers categorized as value or growth style will have a scale of 1 f
Flashcard 1635398061324
| status | not learned | measured difficulty | 37% [default] | last interval [days] | |||
|---|---|---|---|---|---|---|---|
| repetition number in this series | 0 | memorised on | scheduled repetition | ||||
| scheduled repetition interval | last repetition or drill |
Subject 2. Measurement Scales
st level of measurement. It consists of assigning items to groups or categories. No quantitative information is conveyed and no ordering (ranking) of the items is implied. Nominal scales are qualitative rather than quantitative. <span>Religious preference, race, and sex are all examples of nominal scales. Another example is portfolio managers categorized as value or growth style will have a scale of 1 for value and 2 for growth. Frequency distributions are usually used to analyze data me
Flashcard 1635400420620
| status | not learned | measured difficulty | 37% [default] | last interval [days] | |||
|---|---|---|---|---|---|---|---|
| repetition number in this series | 0 | memorised on | scheduled repetition | ||||
| scheduled repetition interval | last repetition or drill |
Subject 2. Measurement Scales
egories. No quantitative information is conveyed and no ordering (ranking) of the items is implied. Nominal scales are qualitative rather than quantitative. Religious preference, race, and sex are all examples of nominal scales. <span>Another example is portfolio managers categorized as value or growth style will have a scale of 1 for value and 2 for growth. Frequency distributions are usually used to analyze data measured on a nominal scale. The main statistic computed is the mode. Variables measured on a nominal scale are often referred t
Flashcard 1635408284940
| status | not learned | measured difficulty | 37% [default] | last interval [days] | |||
|---|---|---|---|---|---|---|---|
| repetition number in this series | 0 | memorised on | scheduled repetition | ||||
| scheduled repetition interval | last repetition or drill |
Subject 2. Measurement Scales
red on a nominal scale are often referred to as categorical or qualitative variables. Ordinal Scale Measurements on an ordinal scale are categorized. The various measurements are then ranked in their categories. <span>Measurements with ordinal scales are ordered with higher numbers representing higher values. The intervals between the numbers are not necessarily equal. Example 1 On a 5-point rating scale measuring attitudes toward gun control, the difference betwe
Flashcard 1635410644236
| status | not learned | measured difficulty | 37% [default] | last interval [days] | |||
|---|---|---|---|---|---|---|---|
| repetition number in this series | 0 | memorised on | scheduled repetition | ||||
| scheduled repetition interval | last repetition or drill |
Subject 2. Measurement Scales
#13; Ordinal Scale Measurements on an ordinal scale are categorized. The various measurements are then ranked in their categories. Measurements with ordinal scales are ordered with higher numbers representing higher values. <span>The intervals between the numbers are not necessarily equal. Example 1 On a 5-point rating scale measuring attitudes toward gun control, the difference between a rating of 2 and a rating of 3 may not represent the same
Flashcard 1635423751436
| status | not learned | measured difficulty | 37% [default] | last interval [days] | |||
|---|---|---|---|---|---|---|---|
| repetition number in this series | 0 | memorised on | scheduled repetition | ||||
| scheduled repetition interval | last repetition or drill |
Subject 2. Measurement Scales
o point for ordinal scales, since the zero point is chosen arbitrarily. The lowest point on the rating scale in the example was arbitrarily chosen to be 1. It could just as well have been 0 or -5. Interval Scale <span>Interval scales rank measurements and ensure that the intervals between the rankings are equal. Scale values can be added and subtracted from each other. For example, if anxiety was measured on an interval scale, a difference between a score of 10 and a score of 11 w
Flashcard 1635430305036
| status | not learned | measured difficulty | 37% [default] | last interval [days] | |||
|---|---|---|---|---|---|---|---|
| repetition number in this series | 0 | memorised on | scheduled repetition | ||||
| scheduled repetition interval | last repetition or drill |
Subject 2. Measurement Scales
3; For example, if anxiety was measured on an interval scale, a difference between a score of 10 and a score of 11 would represent the same difference in anxiety as the difference between a score of 50 and a score of 51. <span>Interval scales do not have a "true" zero point. Therefore, it is not possible to make statements about how many times higher one score is than another. For the anxiety example, it would not be valid to say that a person with a score
Flashcard 1635434237196
| status | not learned | measured difficulty | 37% [default] | last interval [days] | |||
|---|---|---|---|---|---|---|---|
| repetition number in this series | 0 | memorised on | scheduled repetition | ||||
| scheduled repetition interval | last repetition or drill |
Subject 2. Measurement Scales
s twice as anxious as a person with a score of 15. True interval measurement is somewhere between rare and nonexistent in the behavioral sciences. No interval scales measuring anxiety, such as the one described in the example, actually exist. <span>A good example of an interval scale is the Fahrenheit measure of temperature. Equal differences on this scale represent equal differences in temperature, but a temperature of 30°F is not twice as warm as one of 15°F. Ratio Scale Rat
Flashcard 1635438169356
| status | not learned | measured difficulty | 37% [default] | last interval [days] | |||
|---|---|---|---|---|---|---|---|
| repetition number in this series | 0 | memorised on | scheduled repetition | ||||
| scheduled repetition interval | last repetition or drill |
Subject 2. Measurement Scales
an interval scale is the Fahrenheit measure of temperature. Equal differences on this scale represent equal differences in temperature, but a temperature of 30°F is not twice as warm as one of 15°F. Ratio Scale <span>Ratio scales are like interval scales except that they have true zero points. This is the strongest measurement scale. In addition to permitting ranking and addition or subtraction, ratio scales allow computation of meaningful ratios. A good example is the Kelvin
Flashcard 1635440790796
| status | not learned | measured difficulty | 37% [default] | last interval [days] | |||
|---|---|---|---|---|---|---|---|
| repetition number in this series | 0 | memorised on | scheduled repetition | ||||
| scheduled repetition interval | last repetition or drill |
Subject 2. Measurement Scales
on this scale represent equal differences in temperature, but a temperature of 30°F is not twice as warm as one of 15°F. Ratio Scale Ratio scales are like interval scales except that they have true zero points. <span>This is the strongest measurement scale. In addition to permitting ranking and addition or subtraction, ratio scales allow computation of meaningful ratios. A good example is the Kelvin scale of temperature. This scale has an
Flashcard 1636239543564
| status | not learned | measured difficulty | 37% [default] | last interval [days] | |||
|---|---|---|---|---|---|---|---|
| repetition number in this series | 0 | memorised on | scheduled repetition | ||||
| scheduled repetition interval | last repetition or drill |
Subject 3. Frequency Distributions
with individual numbers becomes laborious and messy. In such circumstances, it is neater and more convenient to summarize results into what is known as a frequency table. The data in the display is called a frequency distribution. <span>An interval, also called a class, is a set of values within which an observation falls. Each interval has a lower limit and an upper limit. Intervals must be all-inclusive and non-overlapping. A frequency distribution is a tabular display of data categor
Flashcard 1636249505036
| status | not learned | measured difficulty | 37% [default] | last interval [days] | |||
|---|---|---|---|---|---|---|---|
| repetition number in this series | 0 | memorised on | scheduled repetition | ||||
| scheduled repetition interval | last repetition or drill |
Subject 3. Frequency Distributions
of scores in each interval. The actual number of scores and the percentage of scores in each interval are displayed. This helps in the analysis of large amount of statistical data, and works with all types of measurement scales. <span>Absolute frequency is the actual number of observations in a given interval. Relative frequency is the result of dividing the absolute frequency of each return interval by the total number of observations. Cumulative absol
Flashcard 1636251864332
| status | not learned | measured difficulty | 37% [default] | last interval [days] | |||
|---|---|---|---|---|---|---|---|
| repetition number in this series | 0 | memorised on | scheduled repetition | ||||
| scheduled repetition interval | last repetition or drill |
Subject 3. Frequency Distributions
al are displayed. This helps in the analysis of large amount of statistical data, and works with all types of measurement scales. Absolute frequency is the actual number of observations in a given interval. <span>Relative frequency is the result of dividing the absolute frequency of each return interval by the total number of observations. Cumulative absolute frequency and cumulative relative frequency are the results from cumulating the absolute and relative frequencies as we move from the first to the l
Flashcard 1636263660812
| status | not learned | measured difficulty | 37% [default] | last interval [days] | |||
|---|---|---|---|---|---|---|---|
| repetition number in this series | 0 | memorised on | scheduled repetition | ||||
| scheduled repetition interval | last repetition or drill |
Subject 3. Frequency Distributions
values (i.e., all values can be included in the data set). Examples would include the height of a person and the time to complete an assignment. These values can be measured using sufficiently accurate tools to numerous decimal places. <span>There are two methods that graphically represent continuous data: histograms and frequency polygons. 1. A histogram is a bar chart that displays a frequency distribution. It is constructed as follows: The class frequencies are shown on the vertical (y) axis (by
Flashcard 1636462628108
| status | not learned | measured difficulty | 37% [default] | last interval [days] | |||
|---|---|---|---|---|---|---|---|
| repetition number in this series | 0 | memorised on | scheduled repetition | ||||
| scheduled repetition interval | last repetition or drill |
Subject 3. Frequency Distributions
mber of observations and assign each observation to its class. Count the number of observations in each class. This is called the class frequency. Data can be divided into two types: discrete and continuous. <span>Discrete: The values in the data set can be counted. There are distinct spaces between the values, such as the number of children in a family or the number of shares comprising an index. Continuous: The values in the data set can be measu
Flashcard 1636464987404
| status | not learned | measured difficulty | 37% [default] | last interval [days] | |||
|---|---|---|---|---|---|---|---|
| repetition number in this series | 0 | memorised on | scheduled repetition | ||||
| scheduled repetition interval | last repetition or drill |
Subject 3. Frequency Distributions
ed into two types: discrete and continuous. Discrete: The values in the data set can be counted. There are distinct spaces between the values, such as the number of children in a family or the number of shares comprising an index. <span>Continuous: The values in the data set can be measured. There are normally lots of decimal places involved and (theoretically, at least) there are no gaps between permissible values (i.e., all values can be included in the data set). Example
Flashcard 1636467346700
| status | not learned | measured difficulty | 37% [default] | last interval [days] | |||
|---|---|---|---|---|---|---|---|
| repetition number in this series | 0 | memorised on | scheduled repetition | ||||
| scheduled repetition interval | last repetition or drill |
Subject 3. Frequency Distributions
me to complete an assignment. These values can be measured using sufficiently accurate tools to numerous decimal places. There are two methods that graphically represent continuous data: histograms and frequency polygons. 1. <span>A histogram is a bar chart that displays a frequency distribution. It is constructed as follows: The class frequencies are shown on the vertical (y) axis (by the heights of bars drawn next to each other). The classes (intervals) are shown
Flashcard 1636472065292
| status | not learned | measured difficulty | 37% [default] | last interval [days] | |||
|---|---|---|---|---|---|---|---|
| repetition number in this series | 0 | memorised on | scheduled repetition | ||||
| scheduled repetition interval | last repetition or drill |
Subject 3. Frequency Distributions
polygons. 1. A histogram is a bar chart that displays a frequency distribution. It is constructed as follows: The class frequencies are shown on the vertical (y) axis (by the heights of bars drawn next to each other). <span>The classes (intervals) are shown on the horizontal (x) axis. There is no space between the bars. From a histogram, we can see quickly where most of the observations lie. The shapes of histograms will vary, depending on th
Flashcard 1636476783884
| status | not learned | measured difficulty | 37% [default] | last interval [days] | |||
|---|---|---|---|---|---|---|---|
| repetition number in this series | 0 | memorised on | scheduled repetition | ||||
| scheduled repetition interval | last repetition or drill |
Subject 3. Frequency Distributions
#13; The class frequencies are shown on the vertical (y) axis (by the heights of bars drawn next to each other). The classes (intervals) are shown on the horizontal (x) axis. There is no space between the bars. <span>From a histogram, we can see quickly where most of the observations lie. The shapes of histograms will vary, depending on the choice of the size of the intervals. 2. The frequency polygon is another means of graphically displaying data. It is si
Flashcard 1636481502476
| status | not learned | measured difficulty | 37% [default] | last interval [days] | |||
|---|---|---|---|---|---|---|---|
| repetition number in this series | 0 | memorised on | scheduled repetition | ||||
| scheduled repetition interval | last repetition or drill |
Subject 3. Frequency Distributions
s. There is no space between the bars. From a histogram, we can see quickly where most of the observations lie. The shapes of histograms will vary, depending on the choice of the size of the intervals. 2. <span>The frequency polygon is another means of graphically displaying data. It is similar to a histogram but the bars are replaced by a line joined together. It is constructed in the following manner: Absolute frequency for each interval is plotted
Flashcard 1636487007500
| status | not learned | measured difficulty | 37% [default] | last interval [days] | |||
|---|---|---|---|---|---|---|---|
| repetition number in this series | 0 | memorised on | scheduled repetition | ||||
| scheduled repetition interval | last repetition or drill |
Subject 3. Frequency Distributions
e following manner: Absolute frequency for each interval is plotted on the vertical (y) axis. The midpoint of each class (interval) is shown on the horizontal (x) axis. Neighboring points are connected with a straight line. <span>Unlike a histogram, a frequency polygon adds a degree of continuity to the presentation of the distribution. It is helpful, when drawing a frequency polygon, first to draw a histogram in pencil, then to plot the points and join the lines, and finally to rub out the histogram. In th
Flashcard 1636494085388
| status | not learned | measured difficulty | 37% [default] | last interval [days] | |||
|---|---|---|---|---|---|---|---|
| repetition number in this series | 0 | memorised on | scheduled repetition | ||||
| scheduled repetition interval | last repetition or drill |
Subject 3. Frequency Distributions
st one is -27%. Let's use 6 non-overlapping intervals, each with a width of 10%. The first interval starts at -27% and the last one ends at 33%. Therefore, the entire range of the HPRs is covered. Hint: <span>If, in an examination, your relative frequency column does not sum to 1 (or 100%), you know that you have made a mistake. <span><body><html>
Flashcard 1636515319052
| status | not learned | measured difficulty | 37% [default] | last interval [days] | |||
|---|---|---|---|---|---|---|---|
| repetition number in this series | 0 | memorised on | scheduled repetition | ||||
| scheduled repetition interval | last repetition or drill |
Subject 4. Measures of Center Tendency
Measures of central tendency specify where data are centered. They attempt to use a typical value to represent all the observations in the data set. Population Mean The population mean is the average for a finite populatio
Flashcard 1636517678348
| status | not learned | measured difficulty | 37% [default] | last interval [days] | |||
|---|---|---|---|---|---|---|---|
| repetition number in this series | 0 | memorised on | scheduled repetition | ||||
| scheduled repetition interval | last repetition or drill |
Subject 4. Measures of Center Tendency
head><head> Measures of central tendency specify where data are centered. They attempt to use a typical value to represent all the observations in the data set. Population Mean The population mean is the average for a finite population. It is unique; a given population has only one mean. where: N = the number of observations in the entire population X i = the ith observation ΣX i = add up X i , where i is from 0 to
Flashcard 1636522396940
| status | not learned | measured difficulty | 37% [default] | last interval [days] | |||
|---|---|---|---|---|---|---|---|
| repetition number in this series | 0 | memorised on | scheduled repetition | ||||
| scheduled repetition interval | last repetition or drill |
Subject 4. Measures of Center Tendency
que; a given population has only one mean. where: N = the number of observations in the entire population X i = the ith observation ΣX i = add up X i , where i is from 0 to N <span>Sample Mean The sample mean is the average for a sample. It is a statistic and is used to estimate the population mean. where n = the number of observations in the sample Arithmetic Mean The arithmetic mean is what is commonly called the a
Flashcard 1636524756236
| status | not learned | measured difficulty | 37% [default] | last interval [days] | |||
|---|---|---|---|---|---|---|---|
| repetition number in this series | 0 | memorised on | scheduled repetition | ||||
| scheduled repetition interval | last repetition or drill |
Subject 4. Measures of Center Tendency
stic and is used to estimate the population mean. where n = the number of observations in the sample Arithmetic Mean The arithmetic mean is what is commonly called the average. <span>The population mean and sample mean are both examples of the arithmetic mean. If the data set encompasses an entire population, the arithmetic mean is called a population mean. If the data set includes a sample of values taken from a population, the
Flashcard 1636531834124
| status | not learned | measured difficulty | 37% [default] | last interval [days] | |||
|---|---|---|---|---|---|---|---|
| repetition number in this series | 0 | memorised on | scheduled repetition | ||||
| scheduled repetition interval | last repetition or drill |
Subject 4. Measures of Center Tendency
an. If the data set encompasses an entire population, the arithmetic mean is called a population mean. If the data set includes a sample of values taken from a population, the arithmetic mean is called a sample mean. <span>This is the most widely used measure of central tendency. When the word "mean" is used without a modifier, it can be assumed to refer to the arithmetic mean. The mean is the sum of all scores divided by the number of scores. It is us
Flashcard 1636536552716
| status | not learned | measured difficulty | 37% [default] | last interval [days] | |||
|---|---|---|---|---|---|---|---|
| repetition number in this series | 0 | memorised on | scheduled repetition | ||||
| scheduled repetition interval | last repetition or drill |
Subject 4. Measures of Center Tendency
e assumed to refer to the arithmetic mean. The mean is the sum of all scores divided by the number of scores. It is used to measure the prospective (expected future) performance (return) of an investment over a number of periods. <span>All interval and ratio data sets (e.g., incomes, ages, rates of return) have an arithmetic mean. All data values are considered and included in the arithmetic mean computation. A data set has only one arithmetic mean. This indicates that the mean is unique. The arithmetic mean is t
Flashcard 1636542844172
| status | not learned | measured difficulty | 37% [default] | last interval [days] | |||
|---|---|---|---|---|---|---|---|
| repetition number in this series | 0 | memorised on | scheduled repetition | ||||
| scheduled repetition interval | last repetition or drill |
Subject 4. Measures of Center Tendency
d ratio data sets (e.g., incomes, ages, rates of return) have an arithmetic mean. All data values are considered and included in the arithmetic mean computation. A data set has only one arithmetic mean. This indicates that the mean is unique. <span>The arithmetic mean is the only measure of central tendency where the sum of the deviations of each value from the mean is always zero. Deviation from the arithmetic mean is the distance between the mean and an observation in the data set. The arithmetic mean has the following disadvantages: Th
Flashcard 1636545203468
| status | not learned | measured difficulty | 37% [default] | last interval [days] | |||
|---|---|---|---|---|---|---|---|
| repetition number in this series | 0 | memorised on | scheduled repetition | ||||
| scheduled repetition interval | last repetition or drill |
Subject 4. Measures of Center Tendency
thmetic mean computation. A data set has only one arithmetic mean. This indicates that the mean is unique. The arithmetic mean is the only measure of central tendency where the sum of the deviations of each value from the mean is always zero. <span>Deviation from the arithmetic mean is the distance between the mean and an observation in the data set. The arithmetic mean has the following disadvantages: The mean can be affected by extremes, that is, unusually large or small values. The mean cannot be determi
Flashcard 1636547562764
| status | not learned | measured difficulty | 37% [default] | last interval [days] | |||
|---|---|---|---|---|---|---|---|
| repetition number in this series | 0 | memorised on | scheduled repetition | ||||
| scheduled repetition interval | last repetition or drill |
Subject 4. Measures of Center Tendency
etic mean is the only measure of central tendency where the sum of the deviations of each value from the mean is always zero. Deviation from the arithmetic mean is the distance between the mean and an observation in the data set. <span>The arithmetic mean has the following disadvantages: The mean can be affected by extremes, that is, unusually large or small values. The mean cannot be determined for an open-ended data set (i.e., n is unknown). Geometric Mean The geometric mean has three important
Flashcard 1636554902796
| status | not learned | measured difficulty | 37% [default] | last interval [days] | |||
|---|---|---|---|---|---|---|---|
| repetition number in this series | 0 | memorised on | scheduled repetition | ||||
| scheduled repetition interval | last repetition or drill |
Subject 4. Measures of Center Tendency
s: The mean can be affected by extremes, that is, unusually large or small values. The mean cannot be determined for an open-ended data set (i.e., n is unknown). Geometric Mean <span>The geometric mean has three important properties: It exists only if all the observations are greater than or equal to zero. In other words, it cannot be determined if any value of the data set is zero or negative. If values in the data set are all equal, both the arithmetic and geometric means will be equal to that value. It is always less than the arithmetic mean if values in the data set are not equal. It is typically used when calculating returns over multiple periods. It is a better measure of the compound growth rate of an investment. When returns are variable by perio
Flashcard 1636557262092
| status | not learned | measured difficulty | 37% [default] | last interval [days] | |||
|---|---|---|---|---|---|---|---|
| repetition number in this series | 0 | memorised on | scheduled repetition | ||||
| scheduled repetition interval | last repetition or drill |
Subject 4. Measures of Center Tendency
f the data set is zero or negative. If values in the data set are all equal, both the arithmetic and geometric means will be equal to that value. It is always less than the arithmetic mean if values in the data set are not equal. <span>It is typically used when calculating returns over multiple periods. It is a better measure of the compound growth rate of an investment. When returns are variable by period, the geometric mean will always be less than the arithmetic mean. The more dispe
Flashcard 1636559621388
| status | not learned | measured difficulty | 37% [default] | last interval [days] | |||
|---|---|---|---|---|---|---|---|
| repetition number in this series | 0 | memorised on | scheduled repetition | ||||
| scheduled repetition interval | last repetition or drill |
Subject 4. Measures of Center Tendency
value. It is always less than the arithmetic mean if values in the data set are not equal. It is typically used when calculating returns over multiple periods. It is a better measure of the compound growth rate of an investment. <span>When returns are variable by period, the geometric mean will always be less than the arithmetic mean. The more dispersed the rates of returns, the greater the difference between the two. This measurement is not as highly influenced by extreme values as the arithmetic mean.
Flashcard 1636561980684
| status | not learned | measured difficulty | 37% [default] | last interval [days] | |||
|---|---|---|---|---|---|---|---|
| repetition number in this series | 0 | memorised on | scheduled repetition | ||||
| scheduled repetition interval | last repetition or drill |
Subject 4. Measures of Center Tendency
; It is typically used when calculating returns over multiple periods. It is a better measure of the compound growth rate of an investment. When returns are variable by period, the geometric mean will always be less than the arithmetic mean. <span>The more dispersed the rates of returns, the greater the difference between the two. This measurement is not as highly influenced by extreme values as the arithmetic mean. Weighted Mean The weighted mean is computed by weighting each observed v
Flashcard 1636564602124
| status | not learned | measured difficulty | 37% [default] | last interval [days] | |||
|---|---|---|---|---|---|---|---|
| repetition number in this series | 0 | memorised on | scheduled repetition | ||||
| scheduled repetition interval | last repetition or drill |
Subject 4. Measures of Center Tendency
r measure of the compound growth rate of an investment. When returns are variable by period, the geometric mean will always be less than the arithmetic mean. The more dispersed the rates of returns, the greater the difference between the two. <span>This measurement is not as highly influenced by extreme values as the arithmetic mean. Weighted Mean The weighted mean is computed by weighting each observed value according to its importance. In contrast, the arithmetic mean assigns equal weight
Flashcard 1636566961420
| status | not learned | measured difficulty | 37% [default] | last interval [days] | |||
|---|---|---|---|---|---|---|---|
| repetition number in this series | 0 | memorised on | scheduled repetition | ||||
| scheduled repetition interval | last repetition or drill |
Subject 4. Measures of Center Tendency
less than the arithmetic mean. The more dispersed the rates of returns, the greater the difference between the two. This measurement is not as highly influenced by extreme values as the arithmetic mean. Weighted Mean <span>The weighted mean is computed by weighting each observed value according to its importance. In contrast, the arithmetic mean assigns equal weight to each value. Notice that the return of a portfolio is the weighted mean of the returns of individual assets in the portfolio. The
Flashcard 1636569320716
| status | not learned | measured difficulty | 37% [default] | last interval [days] | |||
|---|---|---|---|---|---|---|---|
| repetition number in this series | 0 | memorised on | scheduled repetition | ||||
| scheduled repetition interval | last repetition or drill |
Subject 4. Measures of Center Tendency
alues as the arithmetic mean. Weighted Mean The weighted mean is computed by weighting each observed value according to its importance. In contrast, the arithmetic mean assigns equal weight to each value. Notice that <span>the return of a portfolio is the weighted mean of the returns of individual assets in the portfolio. The assets are weighted on their market values relative to the market value of the portfolio. When we take a weighted average of forward-looking data, the weighted mean is called expect
Flashcard 1636571942156
| status | not learned | measured difficulty | 37% [default] | last interval [days] | |||
|---|---|---|---|---|---|---|---|
| repetition number in this series | 0 | memorised on | scheduled repetition | ||||
| scheduled repetition interval | last repetition or drill |
Subject 4. Measures of Center Tendency
assigns equal weight to each value. Notice that the return of a portfolio is the weighted mean of the returns of individual assets in the portfolio. The assets are weighted on their market values relative to the market value of the portfolio. <span>When we take a weighted average of forward-looking data, the weighted mean is called expected value. Example A year ago, a certain share had a price of $6. Six months ago, the same share had a price of $6.20. The share is now trading at $7.50. Because the most
Flashcard 1636574301452
| status | not learned | measured difficulty | 37% [default] | last interval [days] | |||
|---|---|---|---|---|---|---|---|
| repetition number in this series | 0 | memorised on | scheduled repetition | ||||
| scheduled repetition interval | last repetition or drill |
Subject 4. Measures of Center Tendency
ice inflates the weighted mean relative to the un-weighted mean. Median In English, the word "mediate" means to go between or to stand in the middle of two groups, in order to act as a referee, so to speak. <span>The median does the same thing; it is the value that stands in the middle of the data set, and divides it into two equal halves, with an equal number of data values in each half. To determine the median, arrange the data from highest to lowest (or lowest to highest) and find the middle observation.
Flashcard 1636576660748
| status | not learned | measured difficulty | 37% [default] | last interval [days] | |||
|---|---|---|---|---|---|---|---|
| repetition number in this series | 0 | memorised on | scheduled repetition | ||||
| scheduled repetition interval | last repetition or drill |
Subject 4. Measures of Center Tendency
groups, in order to act as a referee, so to speak. The median does the same thing; it is the value that stands in the middle of the data set, and divides it into two equal halves, with an equal number of data values in each half. <span>To determine the median, arrange the data from highest to lowest (or lowest to highest) and find the middle observation. If there are an odd number of observations in the data set, the median is the middle observation (n + 1)/2 of the data set. If the number of observation
Flashcard 1636579020044
| status | not learned | measured difficulty | 37% [default] | last interval [days] | |||
|---|---|---|---|---|---|---|---|
| repetition number in this series | 0 | memorised on | scheduled repetition | ||||
| scheduled repetition interval | last repetition or drill |
Subject 4. Measures of Center Tendency
value that stands in the middle of the data set, and divides it into two equal halves, with an equal number of data values in each half. To determine the median, arrange the data from highest to lowest (or lowest to highest) and <span>find the middle observation. If there are an odd number of observations in the data set, the median is the middle observation (n + 1)/2 of the data set. If the number of observations is even, there is no single mid
Flashcard 1636617817356
| status | not learned | measured difficulty | 37% [default] | last interval [days] | |||
|---|---|---|---|---|---|---|---|
| repetition number in this series | 0 | memorised on | scheduled repetition | ||||
| scheduled repetition interval | last repetition or drill |
Subject 4. Measures of Center Tendency
dle of the data set, and divides it into two equal halves, with an equal number of data values in each half. To determine the median, arrange the data from highest to lowest (or lowest to highest) and find the middle observation. <span>If there are an odd number of observations in the data set, the median is the middle observation (n + 1)/2 of the data set. If the number of observations is even, there is no single middle observation (there are two, actually). To find the median, take the arithmetic mean of the two middle o
Flashcard 1636620963084
| status | not learned | measured difficulty | 37% [default] | last interval [days] | |||
|---|---|---|---|---|---|---|---|
| repetition number in this series | 0 | memorised on | scheduled repetition | ||||
| scheduled repetition interval | last repetition or drill |
Subject 4. Measures of Center Tendency
determine the median, arrange the data from highest to lowest (or lowest to highest) and find the middle observation. If there are an odd number of observations in the data set, the median is the middle observation (n + 1)/2 of the data set. <span>If the number of observations is even, there is no single middle observation (there are two, actually). To find the median, take the arithmetic mean of the two middle observations. The median is less sensitive to extreme scores than the mean. This makes it a better measure than the mean for highly skewed distributions. Looking at median income is usua
Flashcard 1636623322380
| status | not learned | measured difficulty | 37% [default] | last interval [days] | |||
|---|---|---|---|---|---|---|---|
| repetition number in this series | 0 | memorised on | scheduled repetition | ||||
| scheduled repetition interval | last repetition or drill |
Subject 4. Measures of Center Tendency
he middle observation (n + 1)/2 of the data set. If the number of observations is even, there is no single middle observation (there are two, actually). To find the median, take the arithmetic mean of the two middle observations. <span>The median is less sensitive to extreme scores than the mean. This makes it a better measure than the mean for highly skewed distributions. Looking at median income is usually more informative than looking at mean income, for example. The sum of the absolute deviations of each number from the median is lower than the sum of
Flashcard 1636625681676
| status | not learned | measured difficulty | 37% [default] | last interval [days] | |||
|---|---|---|---|---|---|---|---|
| repetition number in this series | 0 | memorised on | scheduled repetition | ||||
| scheduled repetition interval | last repetition or drill |
Subject 4. Measures of Center Tendency
, actually). To find the median, take the arithmetic mean of the two middle observations. The median is less sensitive to extreme scores than the mean. This makes it a better measure than the mean for highly skewed distributions. <span>Looking at median income is usually more informative than looking at mean income, for example. The sum of the absolute deviations of each number from the median is lower than the sum of absolute deviations from any other number. Note that whenever you c
Flashcard 1636632759564
| status | not learned | measured difficulty | 37% [default] | last interval [days] | |||
|---|---|---|---|---|---|---|---|
| repetition number in this series | 0 | memorised on | scheduled repetition | ||||
| scheduled repetition interval | last repetition or drill |
Subject 4. Measures of Center Tendency
a median, it is imperative that you place the data in order first. It does not matter whether you order the data from smallest to largest or from largest to smallest, but it does matter that you order the data. Mode <span>Mode means fashion. The mode is the "most fashionable" number in a data set; it is the most frequently occurring score in a distribution and is used as a measure of central tendency. A set of data can have more than one mode, or even no mode. When all values are different, the data set has no mode. When a distribution has one value that appears most frequently, it i
Flashcard 1636635118860
| status | not learned | measured difficulty | 37% [default] | last interval [days] | |||
|---|---|---|---|---|---|---|---|
| repetition number in this series | 0 | memorised on | scheduled repetition | ||||
| scheduled repetition interval | last repetition or drill |
Subject 4. Measures of Center Tendency
ou order the data. Mode Mode means fashion. The mode is the "most fashionable" number in a data set; it is the most frequently occurring score in a distribution and is used as a measure of central tendency. <span>A set of data can have more than one mode, or even no mode. When all values are different, the data set has no mode. When a distribution has one value that appears most frequently, it is said to be unimodal. A data set that has two modes is said
Flashcard 1636637478156
| status | not learned | measured difficulty | 37% [default] | last interval [days] | |||
|---|---|---|---|---|---|---|---|
| repetition number in this series | 0 | memorised on | scheduled repetition | ||||
| scheduled repetition interval | last repetition or drill |
Subject 4. Measures of Center Tendency
fashion. The mode is the "most fashionable" number in a data set; it is the most frequently occurring score in a distribution and is used as a measure of central tendency. A set of data can have more than one mode, or even no mode. <span>When all values are different, the data set has no mode. When a distribution has one value that appears most frequently, it is said to be unimodal. A data set that has two modes is said to be bimodal. The advantage of the mode a
Flashcard 1636641410316
| status | not learned | measured difficulty | 37% [default] | last interval [days] | |||
|---|---|---|---|---|---|---|---|
| repetition number in this series | 0 | memorised on | scheduled repetition | ||||
| scheduled repetition interval | last repetition or drill |
Subject 4. Measures of Center Tendency
to be unimodal. A data set that has two modes is said to be bimodal. The advantage of the mode as a measure of central tendency is that its meaning is obvious. Like the median, the mode is not affected by extreme values. Further, <span>it is the only measure of central tendency that can be used with nominal data. The mode is greatly subject to sample fluctuations and, therefore, is not recommended for use as the only measure of central tendency. A further disadvantage of the mode is that many di
Flashcard 1636652420364
| status | not learned | measured difficulty | 37% [default] | last interval [days] | |||
|---|---|---|---|---|---|---|---|
| repetition number in this series | 0 | memorised on | scheduled repetition | ||||
| scheduled repetition interval | last repetition or drill |
Subject 4. Measures of Center Tendency
ric distributions. The mean is higher than the median in positively skewed distributions and lower than the median in negatively skewed distributions. Extreme values affect the value of the mean, while the median is less affected by outliers. <span>Mode helps to identify shape and skewness of distribution.<span><body><html>
Flashcard 1636817308940
| status | not learned | measured difficulty | 37% [default] | last interval [days] | |||
|---|---|---|---|---|---|---|---|
| repetition number in this series | 0 | memorised on | scheduled repetition | ||||
| scheduled repetition interval | last repetition or drill |
Parent (intermediate) annotation
Open itIn addition to permitting ranking and addition or subtraction, ratio scales allow computation of meaningful ratios.
Original toplevel document
Subject 2. Measurement Scaless in temperature, but a temperature of 30°F is not twice as warm as one of 15°F. Ratio Scale Ratio scales are like interval scales except that they have true zero points. This is the strongest measurement scale. <span>In addition to permitting ranking and addition or subtraction, ratio scales allow computation of meaningful ratios. A good example is the Kelvin scale of temperature. This scale has an absolute zero. Thus, a temperature of 300°K is twice as high as a temperature of 150°K. Two financial examples of ra
Flashcard 1636819668236
| status | not learned | measured difficulty | 37% [default] | last interval [days] | |||
|---|---|---|---|---|---|---|---|
| repetition number in this series | 0 | memorised on | scheduled repetition | ||||
| scheduled repetition interval | last repetition or drill |
Parent (intermediate) annotation
Open itIn a frequency distribution It is important to consider the number of intervals to be used. If too few intervals are used, too much data may be summarized and we may lose important characteristics; if too many intervals are used, we may not summarize enough.
Original toplevel document
Subject 3. Frequency Distributionsthat: Each observation can only lie in one interval. The total number of intervals will incorporate the whole population. The range for an interval is unique. This means a value (observation) can only fall into one interval. <span>It is important to consider the number of intervals to be used. If too few intervals are used, too much data may be summarized and we may lose important characteristics; if too many intervals are used, we may not summarize enough. A frequency distribution is constructed by dividing the scores into intervals and counting the number of scores in each interval. The actual number of scores and the percent
Flashcard 1636834086156
| status | not learned | measured difficulty | 37% [default] | last interval [days] | |||
|---|---|---|---|---|---|---|---|
| repetition number in this series | 0 | memorised on | scheduled repetition | ||||
| scheduled repetition interval | last repetition or drill |
Parent (intermediate) annotation
Open itdata into a frequency distribution together with suggestions on constructing the frequency distribution. Identify the highest and lowest values of the observations. Setup classes (groups into which data is divided). <span>The classes must be mutually exclusive and of equal size. Add up the number of observations and assign each observation to its class. Count the number of observations in each class. This is called the class freque
Original toplevel document
Subject 3. Frequency Distributionsby the total number of observations. Cumulative absolute frequency and cumulative relative frequency are the results from cumulating the absolute and relative frequencies as we move from the first to the last interval. <span>The following steps are required when organizing data into a frequency distribution together with suggestions on constructing the frequency distribution. Identify the highest and lowest values of the observations. Setup classes (groups into which data is divided). The classes must be mutually exclusive and of equal size. Add up the number of observations and assign each observation to its class. Count the number of observations in each class. This is called the class frequency. Data can be divided into two types: discrete and continuous. Discrete: The values in the data set can be counted. There are distinct spaces between the values, such as
Flashcard 1637167795468
| status | not learned | measured difficulty | 37% [default] | last interval [days] | |||
|---|---|---|---|---|---|---|---|
| repetition number in this series | 0 | memorised on | scheduled repetition | ||||
| scheduled repetition interval | last repetition or drill |
Parent (intermediate) annotation
Open itts of decimal places involved and (theoretically, at least) there are no gaps between permissible values (i.e., all values can be included in the data set). Examples would include the height of a person and the time to complete an assignment. <span>These values can be measured using sufficiently accurate tools to numerous decimal places.<span><body><html>
Original toplevel document
Subject 3. Frequency Distributionsed into two types: discrete and continuous. Discrete: The values in the data set can be counted. There are distinct spaces between the values, such as the number of children in a family or the number of shares comprising an index. <span>Continuous: The values in the data set can be measured. There are normally lots of decimal places involved and (theoretically, at least) there are no gaps between permissible values (i.e., all values can be included in the data set). Examples would include the height of a person and the time to complete an assignment. These values can be measured using sufficiently accurate tools to numerous decimal places. There are two methods that graphically represent continuous data: histograms and frequency polygons. 1. A histogram is a bar chart that displays a frequency distributi
Flashcard 1637170154764
| status | not learned | measured difficulty | 37% [default] | last interval [days] | |||
|---|---|---|---|---|---|---|---|
| repetition number in this series | 0 | memorised on | scheduled repetition | ||||
| scheduled repetition interval | last repetition or drill |
Parent (intermediate) annotation
Open itan>Continuous: The values in the data set can be measured. There are normally lots of decimal places involved and (theoretically, at least) there are no gaps between permissible values (i.e., all values can be included in the data set). Examples would include the height of a person and the time to complete an assignment. These values can be measured using sufficiently accurate tools to numerous decimal places.<span><body><html>
Original toplevel document
Subject 3. Frequency Distributionsed into two types: discrete and continuous. Discrete: The values in the data set can be counted. There are distinct spaces between the values, such as the number of children in a family or the number of shares comprising an index. <span>Continuous: The values in the data set can be measured. There are normally lots of decimal places involved and (theoretically, at least) there are no gaps between permissible values (i.e., all values can be included in the data set). Examples would include the height of a person and the time to complete an assignment. These values can be measured using sufficiently accurate tools to numerous decimal places. There are two methods that graphically represent continuous data: histograms and frequency polygons. 1. A histogram is a bar chart that displays a frequency distributi
Flashcard 1637172514060
| status | not learned | measured difficulty | 37% [default] | last interval [days] | |||
|---|---|---|---|---|---|---|---|
| repetition number in this series | 0 | memorised on | scheduled repetition | ||||
| scheduled repetition interval | last repetition or drill |
Parent (intermediate) annotation
Open itContinuous: The values in the data set can be measured. There are normally lots of decimal places involved and (theoretically, at least) there are no gaps between permissible values (i.e., all values can be included in the data set). Example
Original toplevel document
Subject 3. Frequency Distributionsed into two types: discrete and continuous. Discrete: The values in the data set can be counted. There are distinct spaces between the values, such as the number of children in a family or the number of shares comprising an index. <span>Continuous: The values in the data set can be measured. There are normally lots of decimal places involved and (theoretically, at least) there are no gaps between permissible values (i.e., all values can be included in the data set). Examples would include the height of a person and the time to complete an assignment. These values can be measured using sufficiently accurate tools to numerous decimal places. There are two methods that graphically represent continuous data: histograms and frequency polygons. 1. A histogram is a bar chart that displays a frequency distributi
Flashcard 1637607935244
| status | not learned | measured difficulty | 37% [default] | last interval [days] | |||
|---|---|---|---|---|---|---|---|
| repetition number in this series | 0 | memorised on | scheduled repetition | ||||
| scheduled repetition interval | last repetition or drill |
Subject 3. Frequency Distributions
with individual numbers becomes laborious and messy. In such circumstances, it is neater and more convenient to summarize results into what is known as a frequency table. The data in the display is called a frequency distribution. <span>An interval, also called a class, is a set of values within which an observation falls. Each interval has a lower limit and an upper limit. Intervals must be all-inclusive and non-overlapping. A frequency distribution is a tabular display of data categor
Flashcard 1641027865868
| status | not learned | measured difficulty | 37% [default] | last interval [days] | |||
|---|---|---|---|---|---|---|---|
| repetition number in this series | 0 | memorised on | scheduled repetition | ||||
| scheduled repetition interval | last repetition or drill |
Frequency distribution steps
Construction of a Frequency Distribution. Sort (in ascending order) Calculate the range (Range = Maximum value − Minimum value) Intervals creation (decide the number you will put in the frequency distribution, k.) Width determination ( interval width = Range/k.) Ad
Flashcard 1641047002380
| status | not learned | measured difficulty | 37% [default] | last interval [days] | |||
|---|---|---|---|---|---|---|---|
| repetition number in this series | 0 | memorised on | scheduled repetition | ||||
| scheduled repetition interval | last repetition or drill |
Flashcard 1641048837388
| status | not learned | measured difficulty | 37% [default] | last interval [days] | |||
|---|---|---|---|---|---|---|---|
| repetition number in this series | 0 | memorised on | scheduled repetition | ||||
| scheduled repetition interval | last repetition or drill |
Flashcard 1641051458828
| status | not learned | measured difficulty | 37% [default] | last interval [days] | |||
|---|---|---|---|---|---|---|---|
| repetition number in this series | 0 | memorised on | scheduled repetition | ||||
| scheduled repetition interval | last repetition or drill |
Flashcard 1641053293836
| status | not learned | measured difficulty | 37% [default] | last interval [days] | |||
|---|---|---|---|---|---|---|---|
| repetition number in this series | 0 | memorised on | scheduled repetition | ||||
| scheduled repetition interval | last repetition or drill |
Flashcard 1641055128844
| status | not learned | measured difficulty | 37% [default] | last interval [days] | |||
|---|---|---|---|---|---|---|---|
| repetition number in this series | 0 | memorised on | scheduled repetition | ||||
| scheduled repetition interval | last repetition or drill |
Flashcard 1641056963852
| status | not learned | measured difficulty | 37% [default] | last interval [days] | |||
|---|---|---|---|---|---|---|---|
| repetition number in this series | 0 | memorised on | scheduled repetition | ||||
| scheduled repetition interval | last repetition or drill |
Flashcard 1641058798860
| status | not learned | measured difficulty | 37% [default] | last interval [days] | |||
|---|---|---|---|---|---|---|---|
| repetition number in this series | 0 | memorised on | scheduled repetition | ||||
| scheduled repetition interval | last repetition or drill |
Flashcard 1641066138892
| status | not learned | measured difficulty | 37% [default] | last interval [days] | |||
|---|---|---|---|---|---|---|---|
| repetition number in this series | 0 | memorised on | scheduled repetition | ||||
| scheduled repetition interval | last repetition or drill |
Flashcard 1641071643916
| status | not learned | measured difficulty | 37% [default] | last interval [days] | |||
|---|---|---|---|---|---|---|---|
| repetition number in this series | 0 | memorised on | scheduled repetition | ||||
| scheduled repetition interval | last repetition or drill |
Flashcard 1641074003212
| status | not learned | measured difficulty | 37% [default] | last interval [days] | |||
|---|---|---|---|---|---|---|---|
| repetition number in this series | 0 | memorised on | scheduled repetition | ||||
| scheduled repetition interval | last repetition or drill |
Flashcard 1641077673228
| status | not learned | measured difficulty | 37% [default] | last interval [days] | |||
|---|---|---|---|---|---|---|---|
| repetition number in this series | 0 | memorised on | scheduled repetition | ||||
| scheduled repetition interval | last repetition or drill |
Flashcard 1641081343244
| status | not learned | measured difficulty | 37% [default] | last interval [days] | |||
|---|---|---|---|---|---|---|---|
| repetition number in this series | 0 | memorised on | scheduled repetition | ||||
| scheduled repetition interval | last repetition or drill |
Flashcard 1641083178252
| status | not learned | measured difficulty | 37% [default] | last interval [days] | |||
|---|---|---|---|---|---|---|---|
| repetition number in this series | 0 | memorised on | scheduled repetition | ||||
| scheduled repetition interval | last repetition or drill |
Flashcard 1641085013260
| status | not learned | measured difficulty | 37% [default] | last interval [days] | |||
|---|---|---|---|---|---|---|---|
| repetition number in this series | 0 | memorised on | scheduled repetition | ||||
| scheduled repetition interval | last repetition or drill |
Flashcard 1641096023308
| status | not learned | measured difficulty | 37% [default] | last interval [days] | |||
|---|---|---|---|---|---|---|---|
| repetition number in this series | 0 | memorised on | scheduled repetition | ||||
| scheduled repetition interval | last repetition or drill |
Flashcard 1641097858316
| status | not learned | measured difficulty | 37% [default] | last interval [days] | |||
|---|---|---|---|---|---|---|---|
| repetition number in this series | 0 | memorised on | scheduled repetition | ||||
| scheduled repetition interval | last repetition or drill |
Flashcard 1641099693324
| status | not learned | measured difficulty | 37% [default] | last interval [days] | |||
|---|---|---|---|---|---|---|---|
| repetition number in this series | 0 | memorised on | scheduled repetition | ||||
| scheduled repetition interval | last repetition or drill |
Flashcard 1641108868364
| status | not learned | measured difficulty | 37% [default] | last interval [days] | |||
|---|---|---|---|---|---|---|---|
| repetition number in this series | 0 | memorised on | scheduled repetition | ||||
| scheduled repetition interval | last repetition or drill |
Flashcard 1641111489804
| status | not learned | measured difficulty | 37% [default] | last interval [days] | |||
|---|---|---|---|---|---|---|---|
| repetition number in this series | 0 | memorised on | scheduled repetition | ||||
| scheduled repetition interval | last repetition or drill |
Flashcard 1641115159820
| status | not learned | measured difficulty | 37% [default] | last interval [days] | |||
|---|---|---|---|---|---|---|---|
| repetition number in this series | 0 | memorised on | scheduled repetition | ||||
| scheduled repetition interval | last repetition or drill |
Flashcard 1641116994828
| status | not learned | measured difficulty | 37% [default] | last interval [days] | |||
|---|---|---|---|---|---|---|---|
| repetition number in this series | 0 | memorised on | scheduled repetition | ||||
| scheduled repetition interval | last repetition or drill |
Flashcard 1641121451276
| status | not learned | measured difficulty | 37% [default] | last interval [days] | |||
|---|---|---|---|---|---|---|---|
| repetition number in this series | 0 | memorised on | scheduled repetition | ||||
| scheduled repetition interval | last repetition or drill |
Flashcard 1641124334860
| status | not learned | measured difficulty | 37% [default] | last interval [days] | |||
|---|---|---|---|---|---|---|---|
| repetition number in this series | 0 | memorised on | scheduled repetition | ||||
| scheduled repetition interval | last repetition or drill |
Flashcard 1641126956300
| status | not learned | measured difficulty | 37% [default] | last interval [days] | |||
|---|---|---|---|---|---|---|---|
| repetition number in this series | 0 | memorised on | scheduled repetition | ||||
| scheduled repetition interval | last repetition or drill |
Flashcard 1641129577740
| status | not learned | measured difficulty | 37% [default] | last interval [days] | |||
|---|---|---|---|---|---|---|---|
| repetition number in this series | 0 | memorised on | scheduled repetition | ||||
| scheduled repetition interval | last repetition or drill |
Flashcard 1641131412748
| status | not learned | measured difficulty | 37% [default] | last interval [days] | |||
|---|---|---|---|---|---|---|---|
| repetition number in this series | 0 | memorised on | scheduled repetition | ||||
| scheduled repetition interval | last repetition or drill |
Flashcard 1641133509900
| status | not learned | measured difficulty | 37% [default] | last interval [days] | |||
|---|---|---|---|---|---|---|---|
| repetition number in this series | 0 | memorised on | scheduled repetition | ||||
| scheduled repetition interval | last repetition or drill |
Flashcard 1641140325644
| status | not learned | measured difficulty | 37% [default] | last interval [days] | |||
|---|---|---|---|---|---|---|---|
| repetition number in this series | 0 | memorised on | scheduled repetition | ||||
| scheduled repetition interval | last repetition or drill |
Flashcard 1641147141388
| status | not learned | measured difficulty | 37% [default] | last interval [days] | |||
|---|---|---|---|---|---|---|---|
| repetition number in this series | 0 | memorised on | scheduled repetition | ||||
| scheduled repetition interval | last repetition or drill |
Flashcard 1641148976396
| status | not learned | measured difficulty | 37% [default] | last interval [days] | |||
|---|---|---|---|---|---|---|---|
| repetition number in this series | 0 | memorised on | scheduled repetition | ||||
| scheduled repetition interval | last repetition or drill |
Flashcard 1641158937868
| status | not learned | measured difficulty | 37% [default] | last interval [days] | |||
|---|---|---|---|---|---|---|---|
| repetition number in this series | 0 | memorised on | scheduled repetition | ||||
| scheduled repetition interval | last repetition or drill |
Flashcard 1641167588620
| status | not learned | measured difficulty | 37% [default] | last interval [days] | |||
|---|---|---|---|---|---|---|---|
| repetition number in this series | 0 | memorised on | scheduled repetition | ||||
| scheduled repetition interval | last repetition or drill |
Flashcard 1641171520780
| status | not learned | measured difficulty | 37% [default] | last interval [days] | |||
|---|---|---|---|---|---|---|---|
| repetition number in this series | 0 | memorised on | scheduled repetition | ||||
| scheduled repetition interval | last repetition or drill |
Flashcard 1641173355788
| status | not learned | measured difficulty | 37% [default] | last interval [days] | |||
|---|---|---|---|---|---|---|---|
| repetition number in this series | 0 | memorised on | scheduled repetition | ||||
| scheduled repetition interval | last repetition or drill |
Flashcard 1641185414412
| status | not learned | measured difficulty | 37% [default] | last interval [days] | |||
|---|---|---|---|---|---|---|---|
| repetition number in this series | 0 | memorised on | scheduled repetition | ||||
| scheduled repetition interval | last repetition or drill |
Flashcard 1641189870860
| status | not learned | measured difficulty | 37% [default] | last interval [days] | |||
|---|---|---|---|---|---|---|---|
| repetition number in this series | 0 | memorised on | scheduled repetition | ||||
| scheduled repetition interval | last repetition or drill |
Flashcard 1641193540876
| status | not learned | measured difficulty | 37% [default] | last interval [days] | |||
|---|---|---|---|---|---|---|---|
| repetition number in this series | 0 | memorised on | scheduled repetition | ||||
| scheduled repetition interval | last repetition or drill |
Flashcard 1641195375884
| status | not learned | measured difficulty | 37% [default] | last interval [days] | |||
|---|---|---|---|---|---|---|---|
| repetition number in this series | 0 | memorised on | scheduled repetition | ||||
| scheduled repetition interval | last repetition or drill |
Flashcard 1641197210892
| status | not learned | measured difficulty | 37% [default] | last interval [days] | |||
|---|---|---|---|---|---|---|---|
| repetition number in this series | 0 | memorised on | scheduled repetition | ||||
| scheduled repetition interval | last repetition or drill |
Flashcard 1641199045900
| status | not learned | measured difficulty | 37% [default] | last interval [days] | |||
|---|---|---|---|---|---|---|---|
| repetition number in this series | 0 | memorised on | scheduled repetition | ||||
| scheduled repetition interval | last repetition or drill |
Flashcard 1641200880908
| status | not learned | measured difficulty | 37% [default] | last interval [days] | |||
|---|---|---|---|---|---|---|---|
| repetition number in this series | 0 | memorised on | scheduled repetition | ||||
| scheduled repetition interval | last repetition or drill |
Flashcard 1641202715916
| status | not learned | measured difficulty | 37% [default] | last interval [days] | |||
|---|---|---|---|---|---|---|---|
| repetition number in this series | 0 | memorised on | scheduled repetition | ||||
| scheduled repetition interval | last repetition or drill |
Flashcard 1644299422988
| status | not learned | measured difficulty | 37% [default] | last interval [days] | |||
|---|---|---|---|---|---|---|---|
| repetition number in this series | 0 | memorised on | scheduled repetition | ||||
| scheduled repetition interval | last repetition or drill |
Flashcard 1644301257996
| status | not learned | measured difficulty | 37% [default] | last interval [days] | |||
|---|---|---|---|---|---|---|---|
| repetition number in this series | 0 | memorised on | scheduled repetition | ||||
| scheduled repetition interval | last repetition or drill |
Flashcard 1644304928012
| status | not learned | measured difficulty | 37% [default] | last interval [days] | |||
|---|---|---|---|---|---|---|---|
| repetition number in this series | 0 | memorised on | scheduled repetition | ||||
| scheduled repetition interval | last repetition or drill |
Flashcard 1644306763020
| status | not learned | measured difficulty | 37% [default] | last interval [days] | |||
|---|---|---|---|---|---|---|---|
| repetition number in this series | 0 | memorised on | scheduled repetition | ||||
| scheduled repetition interval | last repetition or drill |
Flashcard 1644308598028
| status | not learned | measured difficulty | 37% [default] | last interval [days] | |||
|---|---|---|---|---|---|---|---|
| repetition number in this series | 0 | memorised on | scheduled repetition | ||||
| scheduled repetition interval | last repetition or drill |
Flashcard 1644310695180
| status | not learned | measured difficulty | 37% [default] | last interval [days] | |||
|---|---|---|---|---|---|---|---|
| repetition number in this series | 0 | memorised on | scheduled repetition | ||||
| scheduled repetition interval | last repetition or drill |
Flashcard 1644312005900
| status | not learned | measured difficulty | 37% [default] | last interval [days] | |||
|---|---|---|---|---|---|---|---|
| repetition number in this series | 0 | memorised on | scheduled repetition | ||||
| scheduled repetition interval | last repetition or drill |
Flashcard 1644315413772
| status | not learned | measured difficulty | 37% [default] | last interval [days] | |||
|---|---|---|---|---|---|---|---|
| repetition number in this series | 0 | memorised on | scheduled repetition | ||||
| scheduled repetition interval | last repetition or drill |
Flashcard 1644317248780
| status | not learned | measured difficulty | 37% [default] | last interval [days] | |||
|---|---|---|---|---|---|---|---|
| repetition number in this series | 0 | memorised on | scheduled repetition | ||||
| scheduled repetition interval | last repetition or drill |
Flashcard 1644319083788
| status | not learned | measured difficulty | 37% [default] | last interval [days] | |||
|---|---|---|---|---|---|---|---|
| repetition number in this series | 0 | memorised on | scheduled repetition | ||||
| scheduled repetition interval | last repetition or drill |
Flashcard 1644322753804
| status | not learned | measured difficulty | 37% [default] | last interval [days] | |||
|---|---|---|---|---|---|---|---|
| repetition number in this series | 0 | memorised on | scheduled repetition | ||||
| scheduled repetition interval | last repetition or drill |
Interquartile Range
Another distance measure of dispersion that we may encounter, the interquartile range, focuses on the middle rather than the extremes. The interquartile range (IQR) is the difference between the third and first quartiles o
Flashcard 1644327472396
| status | not learned | measured difficulty | 37% [default] | last interval [days] | |||
|---|---|---|---|---|---|---|---|
| repetition number in this series | 0 | memorised on | scheduled repetition | ||||
| scheduled repetition interval | last repetition or drill |
Interquartile Range
Another distance measure of dispersion that we may encounter, the interquartile range, focuses on the middle rather than the extremes. The interquartile range (IQR) is the difference between the third and first quartiles of a data set: IQR = Q 3 − Q 1 . The IQR represents the length of the interval containing the middle 50 percent of the data, with a larger interquartile range indicating greater dispersion, all else
Flashcard 1644329831692
| status | not learned | measured difficulty | 37% [default] | last interval [days] | |||
|---|---|---|---|---|---|---|---|
| repetition number in this series | 0 | memorised on | scheduled repetition | ||||
| scheduled repetition interval | last repetition or drill |
Interquartile Range
span>Another distance measure of dispersion that we may encounter, the interquartile range, focuses on the middle rather than the extremes. The interquartile range (IQR) is the difference between the third and first quartiles of a data set: <span>IQR = Q 3 − Q 1 . The IQR represents the length of the interval containing the middle 50 percent of the data, with a larger interquartile range indicating greater dispersion, all else equal.</sp
Flashcard 1644332190988
| status | not learned | measured difficulty | 37% [default] | last interval [days] | |||
|---|---|---|---|---|---|---|---|
| repetition number in this series | 0 | memorised on | scheduled repetition | ||||
| scheduled repetition interval | last repetition or drill |
Interquartile Range
ce measure of dispersion that we may encounter, the interquartile range, focuses on the middle rather than the extremes. The interquartile range (IQR) is the difference between the third and first quartiles of a data set: IQR = Q 3 − Q 1 . <span>The IQR represents the length of the interval containing the middle 50 percent of the data, with a larger interquartile range indicating greater dispersion, all else equal.<span><body><html>
Flashcard 1644334550284
| status | not learned | measured difficulty | 37% [default] | last interval [days] | |||
|---|---|---|---|---|---|---|---|
| repetition number in this series | 0 | memorised on | scheduled repetition | ||||
| scheduled repetition interval | last repetition or drill |
Interquartile Range
le rather than the extremes. The interquartile range (IQR) is the difference between the third and first quartiles of a data set: IQR = Q 3 − Q 1 . The IQR represents the length of the interval containing the middle 50 percent of the data, <span>with a larger interquartile range indicating greater dispersion, all else equal.<span><body><html>
Flashcard 1644340579596
| status | not learned | measured difficulty | 37% [default] | last interval [days] | |||
|---|---|---|---|---|---|---|---|
| repetition number in this series | 0 | memorised on | scheduled repetition | ||||
| scheduled repetition interval | last repetition or drill |
Flashcard 1644351851788
| status | not learned | measured difficulty | 37% [default] | last interval [days] | |||
|---|---|---|---|---|---|---|---|
| repetition number in this series | 0 | memorised on | scheduled repetition | ||||
| scheduled repetition interval | last repetition or drill |
Subject 6. Measures of Dispersion
artile range. Example The range of the numbers 1, 2, 4, 6,12,15,19, 26 = 26 - 1 = 25 Recall that the deviation from the arithmetic mean is the distance between the mean and an observation in the data set. <span>The mean absolute deviation (MAD) is the arithmetic average of the absolute deviations around the mean. In calculating the MAD, we ignore the signs of deviations around the mean. Remember that the sum of all the deviations from the mean is equal to
artile range. Example The range of the numbers 1, 2, 4, 6,12,15,19, 26 = 26 - 1 = 25 Recall that the deviation from the arithmetic mean is the distance between the mean and an observation in the data set. <span>The mean absolute deviation (MAD) is the arithmetic average of the absolute deviations around the mean. In calculating the MAD, we ignore the signs of deviations around the mean. Remember that the sum of all the deviations from the mean is equal to
Flashcard 1644353424652
| status | not learned | measured difficulty | 37% [default] | last interval [days] | |||
|---|---|---|---|---|---|---|---|
| repetition number in this series | 0 | memorised on | scheduled repetition | ||||
| scheduled repetition interval | last repetition or drill |
Subject 6. Measures of Dispersion
artile range. Example The range of the numbers 1, 2, 4, 6,12,15,19, 26 = 26 - 1 = 25 Recall that the deviation from the arithmetic mean is the distance between the mean and an observation in the data set. <span>The mean absolute deviation (MAD) is the arithmetic average of the absolute deviations around the mean. In calculating the MAD, we ignore the signs of deviations around the mean. Remember that the sum of all the deviations from the mean is equal to
artile range. Example The range of the numbers 1, 2, 4, 6,12,15,19, 26 = 26 - 1 = 25 Recall that the deviation from the arithmetic mean is the distance between the mean and an observation in the data set. <span>The mean absolute deviation (MAD) is the arithmetic average of the absolute deviations around the mean. In calculating the MAD, we ignore the signs of deviations around the mean. Remember that the sum of all the deviations from the mean is equal to
Flashcard 1644356046092
| status | not learned | measured difficulty | 37% [default] | last interval [days] | |||
|---|---|---|---|---|---|---|---|
| repetition number in this series | 0 | memorised on | scheduled repetition | ||||
| scheduled repetition interval | last repetition or drill |
Flashcard 1644357881100
| status | not learned | measured difficulty | 37% [default] | last interval [days] | |||
|---|---|---|---|---|---|---|---|
| repetition number in this series | 0 | memorised on | scheduled repetition | ||||
| scheduled repetition interval | last repetition or drill |
Flashcard 1644362075404
| status | not learned | measured difficulty | 37% [default] | last interval [days] | |||
|---|---|---|---|---|---|---|---|
| repetition number in this series | 0 | memorised on | scheduled repetition | ||||
| scheduled repetition interval | last repetition or drill |
Flashcard 1644363910412
| status | not learned | measured difficulty | 37% [default] | last interval [days] | |||
|---|---|---|---|---|---|---|---|
| repetition number in this series | 0 | memorised on | scheduled repetition | ||||
| scheduled repetition interval | last repetition or drill |
Flashcard 1644366007564
| status | not learned | measured difficulty | 37% [default] | last interval [days] | |||
|---|---|---|---|---|---|---|---|
| repetition number in this series | 0 | memorised on | scheduled repetition | ||||
| scheduled repetition interval | last repetition or drill |
Flashcard 1644367842572
| status | not learned | measured difficulty | 37% [default] | last interval [days] | |||
|---|---|---|---|---|---|---|---|
| repetition number in this series | 0 | memorised on | scheduled repetition | ||||
| scheduled repetition interval | last repetition or drill |
Flashcard 1644369677580
| status | not learned | measured difficulty | 37% [default] | last interval [days] | |||
|---|---|---|---|---|---|---|---|
| repetition number in this series | 0 | memorised on | scheduled repetition | ||||
| scheduled repetition interval | last repetition or drill |
Flashcard 1644371512588
| status | not learned | measured difficulty | 37% [default] | last interval [days] | |||
|---|---|---|---|---|---|---|---|
| repetition number in this series | 0 | memorised on | scheduled repetition | ||||
| scheduled repetition interval | last repetition or drill |
Subject 6. Measures of Dispersion
ons in the sample. However, the absolute value is difficult to work with mathematically. The variance is a measure of how spread out a distribution is. It is computed as the average squared deviation of each number from its mean. <span>The formula for the variance in a population is where: μ = the mean N = the number of scores When the variance is computed in a sample, the statistic(m = the mean of the sample) can be used
ons in the sample. However, the absolute value is difficult to work with mathematically. The variance is a measure of how spread out a distribution is. It is computed as the average squared deviation of each number from its mean. <span>The formula for the variance in a population is where: μ = the mean N = the number of scores When the variance is computed in a sample, the statistic(m = the mean of the sample) can be used
Flashcard 1644373871884
| status | not learned | measured difficulty | 37% [default] | last interval [days] | |||
|---|---|---|---|---|---|---|---|
| repetition number in this series | 0 | memorised on | scheduled repetition | ||||
| scheduled repetition interval | last repetition or drill |
Flashcard 1644375706892
| status | not learned | measured difficulty | 37% [default] | last interval [days] | |||
|---|---|---|---|---|---|---|---|
| repetition number in this series | 0 | memorised on | scheduled repetition | ||||
| scheduled repetition interval | last repetition or drill |
Flashcard 1644383833356
| status | not learned | measured difficulty | 37% [default] | last interval [days] | |||
|---|---|---|---|---|---|---|---|
| repetition number in this series | 0 | memorised on | scheduled repetition | ||||
| scheduled repetition interval | last repetition or drill |
Flashcard 1644386454796
| status | not learned | measured difficulty | 37% [default] | last interval [days] | |||
|---|---|---|---|---|---|---|---|
| repetition number in this series | 0 | memorised on | scheduled repetition | ||||
| scheduled repetition interval | last repetition or drill |
Subject 6. Measures of Dispersion
n is where: μ = the mean N = the number of scores When the variance is computed in a sample, the statistic(m = the mean of the sample) can be used. However, s 2 is a biased estimate of σ 2 . By far <span>the most common formula for computing variance in a sample is: This gives an unbiased estimate of σ 2 . Since samples are usually used to estimate parameters, s 2 is the most commonly used measure of variance
n is where: μ = the mean N = the number of scores When the variance is computed in a sample, the statistic(m = the mean of the sample) can be used. However, s 2 is a biased estimate of σ 2 . By far <span>the most common formula for computing variance in a sample is: This gives an unbiased estimate of σ 2 . Since samples are usually used to estimate parameters, s 2 is the most commonly used measure of variance
Flashcard 1644390386956
| status | not learned | measured difficulty | 37% [default] | last interval [days] | |||
|---|---|---|---|---|---|---|---|
| repetition number in this series | 0 | memorised on | scheduled repetition | ||||
| scheduled repetition interval | last repetition or drill |
Flashcard 1644394056972
| status | not learned | measured difficulty | 37% [default] | last interval [days] | |||
|---|---|---|---|---|---|---|---|
| repetition number in this series | 0 | memorised on | scheduled repetition | ||||
| scheduled repetition interval | last repetition or drill |
Flashcard 1644397726988
| status | not learned | measured difficulty | 37% [default] | last interval [days] | |||
|---|---|---|---|---|---|---|---|
| repetition number in this series | 0 | memorised on | scheduled repetition | ||||
| scheduled repetition interval | last repetition or drill |
Flashcard 1644399037708
| status | not learned | measured difficulty | 37% [default] | last interval [days] | |||
|---|---|---|---|---|---|---|---|
| repetition number in this series | 0 | memorised on | scheduled repetition | ||||
| scheduled repetition interval | last repetition or drill |
Flashcard 1644408474892
| status | not learned | measured difficulty | 37% [default] | last interval [days] | |||
|---|---|---|---|---|---|---|---|
| repetition number in this series | 0 | memorised on | scheduled repetition | ||||
| scheduled repetition interval | last repetition or drill |
Flashcard 1644417125644
| status | not learned | measured difficulty | 37% [default] | last interval [days] | |||
|---|---|---|---|---|---|---|---|
| repetition number in this series | 0 | memorised on | scheduled repetition | ||||
| scheduled repetition interval | last repetition or drill |
Flashcard 1644423417100
| status | not learned | measured difficulty | 37% [default] | last interval [days] | |||
|---|---|---|---|---|---|---|---|
| repetition number in this series | 0 | memorised on | scheduled repetition | ||||
| scheduled repetition interval | last repetition or drill |
Flashcard 1644425252108
| status | not learned | measured difficulty | 37% [default] | last interval [days] | |||
|---|---|---|---|---|---|---|---|
| repetition number in this series | 0 | memorised on | scheduled repetition | ||||
| scheduled repetition interval | last repetition or drill |
Flashcard 1644428922124
| status | not learned | measured difficulty | 37% [default] | last interval [days] | |||
|---|---|---|---|---|---|---|---|
| repetition number in this series | 0 | memorised on | scheduled repetition | ||||
| scheduled repetition interval | last repetition or drill |
Flashcard 1644438097164
| status | not learned | measured difficulty | 37% [default] | last interval [days] | |||
|---|---|---|---|---|---|---|---|
| repetition number in this series | 0 | memorised on | scheduled repetition | ||||
| scheduled repetition interval | last repetition or drill |
Flashcard 1644439932172
| status | not learned | measured difficulty | 37% [default] | last interval [days] | |||
|---|---|---|---|---|---|---|---|
| repetition number in this series | 0 | memorised on | scheduled repetition | ||||
| scheduled repetition interval | last repetition or drill |
Flashcard 1644444388620
| status | not learned | measured difficulty | 37% [default] | last interval [days] | |||
|---|---|---|---|---|---|---|---|
| repetition number in this series | 0 | memorised on | scheduled repetition | ||||
| scheduled repetition interval | last repetition or drill |
Flashcard 1644448058636
| status | not learned | measured difficulty | 37% [default] | last interval [days] | |||
|---|---|---|---|---|---|---|---|
| repetition number in this series | 0 | memorised on | scheduled repetition | ||||
| scheduled repetition interval | last repetition or drill |
Flashcard 1644449893644
| status | not learned | measured difficulty | 37% [default] | last interval [days] | |||
|---|---|---|---|---|---|---|---|
| repetition number in this series | 0 | memorised on | scheduled repetition | ||||
| scheduled repetition interval | last repetition or drill |
Flashcard 1644453563660
| status | not learned | measured difficulty | 37% [default] | last interval [days] | |||
|---|---|---|---|---|---|---|---|
| repetition number in this series | 0 | memorised on | scheduled repetition | ||||
| scheduled repetition interval | last repetition or drill |
Flashcard 1644455398668
| status | not learned | measured difficulty | 37% [default] | last interval [days] | |||
|---|---|---|---|---|---|---|---|
| repetition number in this series | 0 | memorised on | scheduled repetition | ||||
| scheduled repetition interval | last repetition or drill |
Flashcard 1644457233676
| status | not learned | measured difficulty | 37% [default] | last interval [days] | |||
|---|---|---|---|---|---|---|---|
| repetition number in this series | 0 | memorised on | scheduled repetition | ||||
| scheduled repetition interval | last repetition or drill |
Flashcard 1644466408716
| status | not learned | measured difficulty | 37% [default] | last interval [days] | |||
|---|---|---|---|---|---|---|---|
| repetition number in this series | 0 | memorised on | scheduled repetition | ||||
| scheduled repetition interval | last repetition or drill |
Flashcard 1644474273036
| status | not learned | measured difficulty | 37% [default] | last interval [days] | |||
|---|---|---|---|---|---|---|---|
| repetition number in this series | 0 | memorised on | scheduled repetition | ||||
| scheduled repetition interval | last repetition or drill |
Flashcard 1644484234508
| status | not learned | measured difficulty | 37% [default] | last interval [days] | |||
|---|---|---|---|---|---|---|---|
| repetition number in this series | 0 | memorised on | scheduled repetition | ||||
| scheduled repetition interval | last repetition or drill |
Flashcard 1644487904524
| status | not learned | measured difficulty | 37% [default] | last interval [days] | |||
|---|---|---|---|---|---|---|---|
| repetition number in this series | 0 | memorised on | scheduled repetition | ||||
| scheduled repetition interval | last repetition or drill |
Flashcard 1644493409548
| status | not learned | measured difficulty | 37% [default] | last interval [days] | |||
|---|---|---|---|---|---|---|---|
| repetition number in this series | 0 | memorised on | scheduled repetition | ||||
| scheduled repetition interval | last repetition or drill |
Flashcard 1644495244556
| status | not learned | measured difficulty | 37% [default] | last interval [days] | |||
|---|---|---|---|---|---|---|---|
| repetition number in this series | 0 | memorised on | scheduled repetition | ||||
| scheduled repetition interval | last repetition or drill |
Flashcard 1644498914572
| status | not learned | measured difficulty | 37% [default] | last interval [days] | |||
|---|---|---|---|---|---|---|---|
| repetition number in this series | 0 | memorised on | scheduled repetition | ||||
| scheduled repetition interval | last repetition or drill |
Flashcard 1644500749580
| status | not learned | measured difficulty | 37% [default] | last interval [days] | |||
|---|---|---|---|---|---|---|---|
| repetition number in this series | 0 | memorised on | scheduled repetition | ||||
| scheduled repetition interval | last repetition or drill |
Flashcard 1644550032652
| status | not learned | measured difficulty | 37% [default] | last interval [days] | |||
|---|---|---|---|---|---|---|---|
| repetition number in this series | 0 | memorised on | scheduled repetition | ||||
| scheduled repetition interval | last repetition or drill |
Flashcard 1644551867660
| status | not learned | measured difficulty | 37% [default] | last interval [days] | |||
|---|---|---|---|---|---|---|---|
| repetition number in this series | 0 | memorised on | scheduled repetition | ||||
| scheduled repetition interval | last repetition or drill |
Flashcard 1644553702668
| status | not learned | measured difficulty | 37% [default] | last interval [days] | |||
|---|---|---|---|---|---|---|---|
| repetition number in this series | 0 | memorised on | scheduled repetition | ||||
| scheduled repetition interval | last repetition or drill |
Flashcard 1644557896972
| status | not learned | measured difficulty | 37% [default] | last interval [days] | |||
|---|---|---|---|---|---|---|---|
| repetition number in this series | 0 | memorised on | scheduled repetition | ||||
| scheduled repetition interval | last repetition or drill |
Flashcard 1644562353420
| status | not learned | measured difficulty | 37% [default] | last interval [days] | |||
|---|---|---|---|---|---|---|---|
| repetition number in this series | 0 | memorised on | scheduled repetition | ||||
| scheduled repetition interval | last repetition or drill |
Flashcard 1644564450572
| status | not learned | measured difficulty | 37% [default] | last interval [days] | |||
|---|---|---|---|---|---|---|---|
| repetition number in this series | 0 | memorised on | scheduled repetition | ||||
| scheduled repetition interval | last repetition or drill |
Flashcard 1644568382732
| status | not learned | measured difficulty | 37% [default] | last interval [days] | |||
|---|---|---|---|---|---|---|---|
| repetition number in this series | 0 | memorised on | scheduled repetition | ||||
| scheduled repetition interval | last repetition or drill |
Flashcard 1644570217740
| status | not learned | measured difficulty | 37% [default] | last interval [days] | |||
|---|---|---|---|---|---|---|---|
| repetition number in this series | 0 | memorised on | scheduled repetition | ||||
| scheduled repetition interval | last repetition or drill |
Flashcard 1644577033484
| status | not learned | measured difficulty | 37% [default] | last interval [days] | |||
|---|---|---|---|---|---|---|---|
| repetition number in this series | 0 | memorised on | scheduled repetition | ||||
| scheduled repetition interval | last repetition or drill |
Flashcard 1644583324940
| status | not learned | measured difficulty | 37% [default] | last interval [days] | |||
|---|---|---|---|---|---|---|---|
| repetition number in this series | 0 | memorised on | scheduled repetition | ||||
| scheduled repetition interval | last repetition or drill |
Open it
Note that as n becomes large, the expression reduces to the mean cubed deviation, SK ≈ (1/n) n∑ i=1 (Xi−X) 3 / s 3 . As a frame of reference, for a sample size of 100 or larger taken from a normal distribution, a skewness coefficient of ±0.5 would be considered unusually large.
Flashcard 1644733795596
| status | not learned | measured difficulty | 37% [default] | last interval [days] | |||
|---|---|---|---|---|---|---|---|
| repetition number in this series | 0 | memorised on | scheduled repetition | ||||
| scheduled repetition interval | last repetition or drill |
Flashcard 1644744281356
| status | not learned | measured difficulty | 37% [default] | last interval [days] | |||
|---|---|---|---|---|---|---|---|
| repetition number in this series | 0 | memorised on | scheduled repetition | ||||
| scheduled repetition interval | last repetition or drill |
Flashcard 1644795923724
| status | not learned | measured difficulty | 37% [default] | last interval [days] | |||
|---|---|---|---|---|---|---|---|
| repetition number in this series | 0 | memorised on | scheduled repetition | ||||
| scheduled repetition interval | last repetition or drill |
Flashcard 1644797758732
| status | not learned | measured difficulty | 37% [default] | last interval [days] | |||
|---|---|---|---|---|---|---|---|
| repetition number in this series | 0 | memorised on | scheduled repetition | ||||
| scheduled repetition interval | last repetition or drill |
Flashcard 1644799593740
| status | not learned | measured difficulty | 37% [default] | last interval [days] | |||
|---|---|---|---|---|---|---|---|
| repetition number in this series | 0 | memorised on | scheduled repetition | ||||
| scheduled repetition interval | last repetition or drill |
Flashcard 1644801428748
| status | not learned | measured difficulty | 37% [default] | last interval [days] | |||
|---|---|---|---|---|---|---|---|
| repetition number in this series | 0 | memorised on | scheduled repetition | ||||
| scheduled repetition interval | last repetition or drill |
Flashcard 1644803525900
| status | not learned | measured difficulty | 37% [default] | last interval [days] | |||
|---|---|---|---|---|---|---|---|
| repetition number in this series | 0 | memorised on | scheduled repetition | ||||
| scheduled repetition interval | last repetition or drill |
Flashcard 1644805360908
| status | not learned | measured difficulty | 37% [default] | last interval [days] | |||
|---|---|---|---|---|---|---|---|
| repetition number in this series | 0 | memorised on | scheduled repetition | ||||
| scheduled repetition interval | last repetition or drill |
Flashcard 1644807720204
| status | not learned | measured difficulty | 37% [default] | last interval [days] | |||
|---|---|---|---|---|---|---|---|
| repetition number in this series | 0 | memorised on | scheduled repetition | ||||
| scheduled repetition interval | last repetition or drill |
Flashcard 1644814011660
| status | not learned | measured difficulty | 37% [default] | last interval [days] | |||
|---|---|---|---|---|---|---|---|
| repetition number in this series | 0 | memorised on | scheduled repetition | ||||
| scheduled repetition interval | last repetition or drill |
Flashcard 1644819778828
| status | not learned | measured difficulty | 37% [default] | last interval [days] | |||
|---|---|---|---|---|---|---|---|
| repetition number in this series | 0 | memorised on | scheduled repetition | ||||
| scheduled repetition interval | last repetition or drill |
Flashcard 1644971822348
| status | not learned | measured difficulty | 37% [default] | last interval [days] | |||
|---|---|---|---|---|---|---|---|
| repetition number in this series | 0 | memorised on | scheduled repetition | ||||
| scheduled repetition interval | last repetition or drill |
Flashcard 1644973657356
| status | not learned | measured difficulty | 37% [default] | last interval [days] | |||
|---|---|---|---|---|---|---|---|
| repetition number in this series | 0 | memorised on | scheduled repetition | ||||
| scheduled repetition interval | last repetition or drill |
Flashcard 1644977589516
| status | not learned | measured difficulty | 37% [default] | last interval [days] | |||
|---|---|---|---|---|---|---|---|
| repetition number in this series | 0 | memorised on | scheduled repetition | ||||
| scheduled repetition interval | last repetition or drill |
Flashcard 1644986240268
| status | not learned | measured difficulty | 37% [default] | last interval [days] | |||
|---|---|---|---|---|---|---|---|
| repetition number in this series | 0 | memorised on | scheduled repetition | ||||
| scheduled repetition interval | last repetition or drill |
Flashcard 1645093719308
| status | not learned | measured difficulty | 37% [default] | last interval [days] | |||
|---|---|---|---|---|---|---|---|
| repetition number in this series | 0 | memorised on | scheduled repetition | ||||
| scheduled repetition interval | last repetition or drill |
Flashcard 1645869403404
| status | not learned | measured difficulty | 37% [default] | last interval [days] | |||
|---|---|---|---|---|---|---|---|
| repetition number in this series | 0 | memorised on | scheduled repetition | ||||
| scheduled repetition interval | last repetition or drill |
Open it
In calculations of variance since the deviations around the mean are squared, we do not know whether large deviations are likely to be positive or negative.
Flashcard 1645875432716
| status | not learned | measured difficulty | 37% [default] | last interval [days] | |||
|---|---|---|---|---|---|---|---|
| repetition number in this series | 0 | memorised on | scheduled repetition | ||||
| scheduled repetition interval | last repetition or drill |
Open it
The arithmetic mean is a special case of the weighted mean in which all the weights are equal to 1/n.
Flashcard 1646664224012
| status | not learned | measured difficulty | 37% [default] | last interval [days] | |||
|---|---|---|---|---|---|---|---|
| repetition number in this series | 0 | memorised on | scheduled repetition | ||||
| scheduled repetition interval | last repetition or drill |
Open it
The importance of Chebyshev’s inequality stems from its generality. The inequality holds for samples and populations and for discrete and continuous data regardless of the shape of the distribution. As we shall see in the reading on sampling, we can ma
Flashcard 1648564768012
| status | not learned | measured difficulty | 37% [default] | last interval [days] | |||
|---|---|---|---|---|---|---|---|
| repetition number in this series | 0 | memorised on | scheduled repetition | ||||
| scheduled repetition interval | last repetition or drill |
Flashcard 1648835562764
| status | not learned | measured difficulty | 37% [default] | last interval [days] | |||
|---|---|---|---|---|---|---|---|
| repetition number in this series | 0 | memorised on | scheduled repetition | ||||
| scheduled repetition interval | last repetition or drill |