Edited, memorised or added to reading queue

on 31-May-2022 (Tue)

Do you want BuboFlash to help you learning these things? Click here to log in or create user.

Flashcard 7092440796428

Answer
The term “fermentation” is derived from the Latin verb fervere, to boil, thus describ- ing the appearance of the action of yeast on the extracts of fruit or malted grain. The boiling appearance is due to the production of carbon dioxide bubbles caused by the anaerobic catabolism of the sugar present in the extract.

statusnot learnedmeasured difficulty37% [default]last interval [days]               
repetition number in this series0memorised on               scheduled repetition               
scheduled repetition interval               last repetition or drill

pdf

cannot see any pdfs


Flashcard 7092832177420

Question
[default - edit me]
Answer

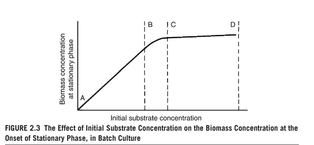
However, growth results in the consumption of nu- trients and the excretion of microbial products; events which influence the growth of the organism. Thus, after a certain time the growth rate of the culture decreases until growth ceases. The cessation of growth may be due to the depletion of some essential nutrient in the medium (substrate limitation), the accumulation of some autotoxic product of the organism in the medium (toxin limitation) or a combination of the two. The nature of the limitation of growth may be explored by growing the organ- ism in the presence of a range of substrate concentrations and plotting the biomass concentration at stationary phase against the initial substrate concentration, as shown in Fig. 2.3. From Fig. 2.3 it may be seen that over the zone A to B an increase in initial substrate concentration gives a proportional increase in the biomass produced at stationary phase, indicating that the substrate is limiting. The situation may be described by the equation: =− xY Ss(

where x is the concentration of biomass produced, Y is the yield factor (g biomass produced g

–1 substrate consumed), S R is the initial substrate concentration, and s is the residual substrate concentration. Over the zone A to B in Fig. 2.3, s equals zero at the point of cessation of growth.

Thus, Eq. (2.4) may be used to predict the biomass that may be produced from a certain amount of substrate. Over the zone C to D an increase in the initial substrate concentration does not give a proportional increase in biomass. This may be due to

either the exhaustion of another substrate or the accumulation of toxic products. Over the zone B to C the utilization of the substrate is deleteriously affected by either the accumulating toxins or the availability of another substrate


statusnot learnedmeasured difficulty37% [default]last interval [days]               
repetition number in this series0memorised on               scheduled repetition               
scheduled repetition interval               last repetition or drill

pdf

cannot see any pdfs


Flashcard 7092835585292

Tags
#has-images


statusnot learnedmeasured difficulty37% [default]last interval [days]               
repetition number in this series0memorised on               scheduled repetition               
scheduled repetition interval               last repetition or drill

pdf

cannot see any pdfs


Flashcard 7092837682444

Question
[default - edit me]
Answer
The yield factor (Y) is a measure of the efficiency of conversion of any one sub- strate into biomass and it can be used to predict the substrate concentration required to produce a certain biomass concentration. However, it is important to appreciate that Y is not a constant—it will vary according to growth rate, pH, temperature, the limiting substrate, and the concentration of the substrates in excess.

statusnot learnedmeasured difficulty37% [default]last interval [days]               
repetition number in this series0memorised on               scheduled repetition               
scheduled repetition interval               last repetition or drill

pdf

cannot see any pdfs


Flashcard 7092838731020

Question
[default - edit me]
Answer

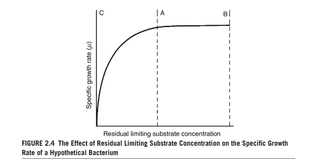
The decrease in growth rate and the cessation of growth, due to the depletion of substrate, may be described by the relationship between µ and the residual growth- limiting substrate, represented in Eq. (2.5) and in Fig. 2.4 (Monod, 1942): µµ =+ sK s/( ) smax (2.5) Where, s is the substrate concentration in the presence of the organism, K s is the substrate utilization constant, numerically equal to substrate concentration, when µ is half µ max and is a measure of the affinity of the organism for its substrate. The zone A to B in Fig. 2.4 is equivalent to the exponential phase in batch cul- ture where substrate concentration is in excess and growth is at µ max . The zone C to A in Fig. 2.4 is equivalent to the deceleration phase of batch culture where the growth of the organism has resulted in the depletion of substrate to a growth-limiting concentration which will not support µ max . If the organism has a very high affinity for the limiting substrate (a low K s value), the growth rate will not be affected until the substrate concentration has declined to a very low level. Thus, the deceleration phase for such a culture would be short. However, if the organism has a low affin- ity for the substrate (a high K s value) the growth rate will be deleteriously affected at a relatively high substrate concentration. Thus, the deceleration phase for such a culture would be relatively long. Typical values of K s for a range of organisms and

substrates are shown in Table 2.2, from which it may be seen that such values are

usually very small and the affinity for substrate is high. It will be appreciated that

the biomass concentration at the end of the exponential phase is at its highest and,

thus, the decline in substrate concentration will be very rapid so that the time period

during which the substrate concentration is close to K

s

is very short. While the con-

cept of K

s

facilitates the quantitative description of the relationship between specific

growth rate and substrate concentration it should not be regarded as a true constant.


statusnot learnedmeasured difficulty37% [default]last interval [days]               
repetition number in this series0memorised on               scheduled repetition               
scheduled repetition interval               last repetition or drill

pdf

cannot see any pdfs


Flashcard 7092842138892

Tags
#has-images


statusnot learnedmeasured difficulty37% [default]last interval [days]               
repetition number in this series0memorised on               scheduled repetition               
scheduled repetition interval               last repetition or drill

pdf

cannot see any pdfs


Flashcard 7092843449612

Question
[default - edit me]
Answer

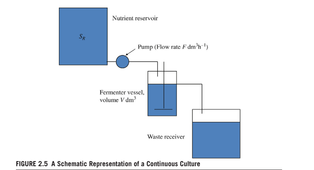
Exponential growth in batch culture may be prolonged by the addition of fresh me- dium to the vessel. Provided that the medium has been designed such that growth is substrate limited (ie, by some component of the medium), and not toxin limited, exponential growth will proceed until the additional substrate is exhausted. This ex- ercise may be repeated until the vessel is full. However, if an overflow device was fitted to the fermenter such that the added medium displaced an equal volume of cul- ture from the vessel then continuous production of cells could be achieved (Fig. 2.5). If medium is fed continuously to such a culture at a suitable rate, a steady state is

achieved eventually, that is, formation of new biomass by the culture is balanced by

the loss of cells from the vessel. The flow of medium into the vessel is related to the

volume of the vessel by the term dilution rate, D, defined as:

=D

F

V

(2.9)

where F is the flow rate (dm

3

h

–1

) and V is the volume (dm

3

).

Thus, D is expressed in the unit h

–1


statusnot learnedmeasured difficulty37% [default]last interval [days]               
repetition number in this series0memorised on               scheduled repetition               
scheduled repetition interval               last repetition or drill

pdf

cannot see any pdfs


Flashcard 7092846071052

Tags
#has-images


statusnot learnedmeasured difficulty37% [default]last interval [days]               
repetition number in this series0memorised on               scheduled repetition               
scheduled repetition interval               last repetition or drill

pdf

cannot see any pdfs


Flashcard 7092847381772

Question
[default - edit me]
Answer
The net change in cell concentration over a time period may be expressed as: =− dx dt growth output or µ =− dx dt xD x. (2.10) Under steady-state conditions the cell concentration remains constant, thus dx/dt = 0 and: µ =xD x (2.11) and µ = D. (2.12) Thus, under steady-state conditions the specific growth rate is controlled by the dilution rate, which is an experimental variable. It will be recalled that under batch culture conditions, an organism will grow at its maximum specific growth rate and, therefore, it is obvious that a continuous culture may be operated only at dilution rates below the maximum specific growth rate. Thus, within certain limits, the dilu- tion rate may be used to control the growth rate of the culture. The growth of the cells in a continuous culture of this type is controlled by the availability of the growth limiting chemical component of the medium and, thus, the system is described as a chemostat. The mechanism underlying the controlling effect of the dilution rate is essentially the relationship expressed in Eq. (2.5), demonstrated by Monod in 1942: µµ =+ sK s/( ) smax At steady state, µ = D, and, therefore, µ =+ Ds Ks /( ) smax where s is the steady-state concentration of substrate in the chemostat, and µ = − s KD D ()

statusnot learnedmeasured difficulty37% [default]last interval [days]               
repetition number in this series0memorised on               scheduled repetition               
scheduled repetition interval               last repetition or drill

pdf

cannot see any pdfs


Flashcard 7092849216780

Question
[default - edit me]
Answer
Eq. (2.13) predicts that the substrate concentration is determined by the dilution rate. In effect, this occurs by growth of the cells depleting the substrate to a concen- tration that supports the growth rate equal to the dilution rate. If substrate is depleted below the level that supports the growth rate dictated by the dilution rate, the follow- ing sequence of events takes place: 1. The growth rate of the cells will be less than the dilution rate and they will be washed out of the vessel at a rate greater than they are being produced, resulting in a decrease in biomass concentration. 2. The substrate concentration in the vessel will rise because fewer cells are left in the vessel to consume it. 3. The increased substrate concentration in the vessel will result in the cells growing at a rate greater than the dilution rate and biomass concentration will increase. 4. The steady state will be reestablished.

statusnot learnedmeasured difficulty37% [default]last interval [days]               
repetition number in this series0memorised on               scheduled repetition               
scheduled repetition interval               last repetition or drill

pdf

cannot see any pdfs


Flashcard 7092850265356

Question
[default - edit me]
Answer
The concentration of cells in the chemostat at steady state is described by the equation: =− xY Ss() R (2.14) Where, x is the steady-state cell concentration in the chemostat. By combining Eqs. (2.13) and (2.14), then: µ =− − xYS KD D () R s max (2.15) Thus, the biomass concentration at steady state is determined by the operational variables, S R and D. If S R is increased, x will increase but s , the residual substrate concentration in the chemostat at the new steady state, will remain the same. If D is increased, µ will increase (µ = D) and the residual substrate at the new steady state would have increased to support the elevated growth rate; thus, less substrate will be available to be converted into biomass, resulting in a lower biomass steady state value.

statusnot learnedmeasured difficulty37% [default]last interval [days]               
repetition number in this series0memorised on               scheduled repetition               
scheduled repetition interval               last repetition or drill

pdf

cannot see any pdfs


Flashcard 7092851313932

Question
[default - edit me]
Answer
the term fed-batch culture to describe batch cultures which are fed continuously, or sequentially, with medium, without the removal of culture fluid. A fed-batch culture is established initially in batch mode and is then fed according to one of the following feed strategies: 1. The same medium used to establish the batch culture is added, resulting in an increase in volume. 2. A solution of the limiting substrate at the same concentration as that in the initial medium is added, resulting in an increase in volume. 3. A concentrated solution of the limiting substrate is added at a rate less than in (1) and (2), resulting in an increase in volume. 4. A very concentrated solution of the limiting substrate is added at a rate less than in (1), (2), and (3), resulting in an insignificant increase in volume. Fed-batch systems employing strategies (1) and (2) are described as variable vol- ume, whereas a system employing strategy (4) is described as fixed volume. The use of strategy (3) gives a culture intermediate between the two extremes of variable and fixed volume

statusnot learnedmeasured difficulty37% [default]last interval [days]               
repetition number in this series0memorised on               scheduled repetition               
scheduled repetition interval               last repetition or drill

pdf

cannot see any pdfs


Flashcard 7092852362508

Question
[default - edit me]
Answer
All microorganisms require water, sources of energy, carbon, nitrogen, mineral elements, and possibly vitamins plus oxygen if aerobic. On a small scale it is relatively simple to devise a medium containing pure compounds, but the result- ing medium, although supporting satisfactory growth, may be unsuitable for use in a large scale process. On a large scale one must normally use sources of nutrients to create a medium which will meet as many as possible of the following criteria: 1. It will produce the maximum yield of product or biomass per gram of substrate used. 2. It will produce the maximum concentration of product or biomass. 3. It will permit the maximum rate of product formation. 4. There will be the minimum yield of undesired products. 5. It will be of a consistent quality and be readily available throughout the year. 6. It will cause minimal problems during media making and sterilization. 7. It will cause minimal problems in other aspects of the production process particularly aeration and agitation, extraction, purification, and waste treatment.

statusnot learnedmeasured difficulty37% [default]last interval [days]               
repetition number in this series0memorised on               scheduled repetition               
scheduled repetition interval               last repetition or drill

pdf

cannot see any pdfs


Flashcard 7092853411084

Question
[default - edit me]
Answer
Medium formulation is an essential stage in the design of successful laboratory ex- periments, pilot-scale development, and manufacturing processes. The constituents of a medium must satisfy the elemental requirements for cell biomass and metabolite production and there must be an adequate supply of energy for biosynthesis and cell

statusnot learnedmeasured difficulty37% [default]last interval [days]               
repetition number in this series0memorised on               scheduled repetition               
scheduled repetition interval               last repetition or drill

pdf

cannot see any pdfs


Flashcard 7092854459660

Question
[default - edit me]
Answer
Water is the major component of almost all fermentation media, and is needed in many of the ancillary services such as heating, cooling, cleaning, and rinsing. Clean water of consistent composition is therefore required in large quantities from reliable permanent sources. When assessing the suitability of a water supply it is important to consider pH, dissolved salts, and effluent contamination

statusnot learnedmeasured difficulty37% [default]last interval [days]               
repetition number in this series0memorised on               scheduled repetition               
scheduled repetition interval               last repetition or drill

pdf

cannot see any pdfs


Flashcard 7092855508236

Question
[default - edit me]
Answer
Energy for growth comes from either the oxidation of medium components or from light. Most industrial microorganisms are chemoorganotrophs, therefore the com- monest source of energy will be the carbon source such as carbohydrates, lipids, and proteins. Some microorganisms can also use hydrocarbons or methanol as carbon and energy sources

statusnot learnedmeasured difficulty37% [default]last interval [days]               
repetition number in this series0memorised on               scheduled repetition               
scheduled repetition interval               last repetition or drill

pdf

cannot see any pdfs


#AI #PR #inspiration #marketing #promo
How to: Use AI to make your PR more human Workflows to improve the quality of your communications
statusnot read reprioritisations
last reprioritisation on suggested re-reading day
started reading on finished reading on

pdf

cannot see any pdfs


#AI #inspiration #marketing #promo
B2B MARKETING AUTOMATION PLATFORMS: A MARKETER’S GUIDE
statusnot read reprioritisations
last reprioritisation on suggested re-reading day
started reading on finished reading on

pdf

cannot see any pdfs


Flashcard 7092963511564

Tags
#causality #statistics
Question
The graph with edges removed is known as the [...] graph
Answer
manipulated

statusnot learnedmeasured difficulty37% [default]last interval [days]               
repetition number in this series0memorised on               scheduled repetition               
scheduled repetition interval               last repetition or drill

Parent (intermediate) annotation

Open it
The graph with edges removed is known as the manipulated graph

Original toplevel document (pdf)

cannot see any pdfs


Flashcard 7092965346572

Tags
#causality #statistics
Question
In causal graphs, causation flows along [...] paths.
Answer
directed

statusnot learnedmeasured difficulty37% [default]last interval [days]               
repetition number in this series0memorised on               scheduled repetition               
scheduled repetition interval               last repetition or drill

Parent (intermediate) annotation

Open it
In causal graphs, causation flows along directed paths.

Original toplevel document (pdf)

cannot see any pdfs


Flashcard 7092967181580

Tags
#causality #statistics
Question
Whenever, do(𝑡) appears after the conditioning bar, it means that everything in that expression is in the post-intervention world where the intervention do(𝑡) occurs. For example, 𝔼[𝑌 | do(𝑡), 𝑍 = 𝑧] refers to the expected outcome in the subpopulation where 𝑍 = 𝑧 after the [...] subpopulation has taken treatment 𝑡 .
Answer
whole

statusnot learnedmeasured difficulty37% [default]last interval [days]               
repetition number in this series0memorised on               scheduled repetition               
scheduled repetition interval               last repetition or drill

Parent (intermediate) annotation

Open it
that expression is in the post-intervention world where the intervention do(𝑡) occurs. For example, 𝔼[𝑌 | do(𝑡), 𝑍 = 𝑧] refers to the expected outcome in the subpopulation where 𝑍 = 𝑧 after the <span>whole subpopulation has taken treatment 𝑡 . <span>

Original toplevel document (pdf)

cannot see any pdfs


Flashcard 7092969016588

Tags
#causality #statistics
Question
Whenever, do(𝑡) appears after the conditioning bar, it means that everything in that expression is in the [...] world where the intervention do(𝑡) occurs.
Answer
post-intervention

statusnot learnedmeasured difficulty37% [default]last interval [days]               
repetition number in this series0memorised on               scheduled repetition               
scheduled repetition interval               last repetition or drill

Parent (intermediate) annotation

Open it
Whenever, do(𝑡) appears after the conditioning bar, it means that everything in that expression is in the post-intervention world where the intervention do(𝑡) occurs.

Original toplevel document (pdf)

cannot see any pdfs


#causality #statistics
if the treatment specification is simply “get a dog” or “don’t get a dog,” this can be too coarse to yield consistency. It might be that if I were to get a puppy, I would observe 𝑌 = 1 (happiness) because I needed an energetic friend, but if I were to get an old, low-energy dog, I would observe 𝑌 = 0 (unhappiness).
statusnot read reprioritisations
last reprioritisation on suggested re-reading day
started reading on finished reading on


Parent (intermediate) annotation

Open it
It might seem like consistency is obviously true, but that is not always the case. For example, if the treatment specification is simply “get a dog” or “don’t get a dog,” this can be too coarse to yield consistency. It might be that if I were to get a puppy, I would observe 𝑌 = 1 (happiness) because I needed an energetic friend, but if I were to get an old, low-energy dog, I would observe 𝑌 = 0 (unhappiness).

Original toplevel document (pdf)

cannot see any pdfs


#causality #statistics
consistency encompasses the assumption that is sometimes referred to as “no multiple versions of treatment.”
statusnot read reprioritisations
last reprioritisation on suggested re-reading day
started reading on finished reading on


Parent (intermediate) annotation

Open it
dog,” so both correspond to 𝑇 = 1 . This means that 𝑌(1) is not well defined, since it will be 1 or 0, depending on something that is not captured by the treatment specification. In this sense, <span>consistency encompasses the assumption that is sometimes referred to as “no multiple versions of treatment.” <span>

Original toplevel document (pdf)

cannot see any pdfs


Flashcard 7092974521612

Tags
#causality #has-images #statistics


Question
However, we do have [...] exchangeability in the data. This is because, when we condition on 𝑋 , there is no longer any non-causal association between 𝑇 and 𝑌 . The non-causal association is now “blocked” at 𝑋 by conditioning on 𝑋 . We illustrate this blocking in Figure 2.4 by shading 𝑋 to indicate it is conditioned on and by showing the red dashed arc being blocked there
Answer
conditional

statusnot learnedmeasured difficulty37% [default]last interval [days]               
repetition number in this series0memorised on               scheduled repetition               
scheduled repetition interval               last repetition or drill

Parent (intermediate) annotation

Open it
However, we do have conditional exchangeability in the data. This is because, when we condition on 𝑋 , there is no longer any non-causal association between 𝑇 and 𝑌 . The non-causal association is now “blocked” at 𝑋 b

Original toplevel document (pdf)

cannot see any pdfs


#causality #statistics
SUTVA is a combination of consistency and no interference (and also deterministic potential outcomes)
statusnot read reprioritisations
last reprioritisation on suggested re-reading day
started reading on finished reading on


Parent (intermediate) annotation

Open it
SUTVA is satisfied if unit (individual) 𝑖 ’s outcome is simply a function of unit 𝑖 ’s treatment. Therefore, SUTVA is a combination of consistency and no interference (and also deterministic potential outcomes)

Original toplevel document (pdf)

cannot see any pdfs


Flashcard 7092978453772

Tags
#causality #statistics
Question

The Positivity-Unconfoundedness Tradeoff

Although conditioning on more covariates could lead to a higher chance of satisfying unconfoundedness, it can lead to a higher chance of violating positivity. As we [...] the dimension of the covariates, we make the subgroups for any level 𝑥 of the covariates smaller.

Answer
increase

statusnot learnedmeasured difficulty37% [default]last interval [days]               
repetition number in this series0memorised on               scheduled repetition               
scheduled repetition interval               last repetition or drill

Parent (intermediate) annotation

Open it
ty-Unconfoundedness Tradeoff Although conditioning on more covariates could lead to a higher chance of satisfying unconfoundedness, it can lead to a higher chance of violating positivity. As we <span>increase the dimension of the covariates, we make the subgroups for any level 𝑥 of the covariates smaller. <span>

Original toplevel document (pdf)

cannot see any pdfs


Flashcard 7092980550924

Tags
#causality #statistics
Question
As we discussed in Section 4.2, the graph for the interventional distribution 𝑃(𝑌 | do(𝑡)) is the same as the graph for the observational distribution 𝑃(𝑌, 𝑇, 𝑋) , but with the [...(direction?)] edges to 𝑇 removed.
Answer
incoming

statusnot learnedmeasured difficulty37% [default]last interval [days]               
repetition number in this series0memorised on               scheduled repetition               
scheduled repetition interval               last repetition or drill

Parent (intermediate) annotation

Open it
As we discussed in Section 4.2, the graph for the interventional distribution 𝑃(𝑌 | do(𝑡)) is the same as the graph for the observational distribution 𝑃(𝑌, 𝑇, 𝑋) , but with the incoming edges to 𝑇 removed.

Original toplevel document (pdf)

cannot see any pdfs


Flashcard 7092982648076

Tags
#causality #statistics
Question
The Bayesian network [...] is also known as the chain rule for Bayesian networks or Markov compatibility.
Answer
factorization

statusnot learnedmeasured difficulty37% [default]last interval [days]               
repetition number in this series0memorised on               scheduled repetition               
scheduled repetition interval               last repetition or drill

Parent (intermediate) annotation

Open it
The Bayesian network factorization is also known as the chain rule for Bayesian networks or Markov compatibility.

Original toplevel document (pdf)

cannot see any pdfs


Flashcard 7092985007372

Tags
#DAG #causal #edx
Question
When there is an association between A and Y, even if A has a null causal effect, a zero causal effect on Y, then we say that there is bias [...].
Answer
under the null

statusnot learnedmeasured difficulty37% [default]last interval [days]               
repetition number in this series0memorised on               scheduled repetition               
scheduled repetition interval               last repetition or drill

Parent (intermediate) annotation

Open it
When there is an association between A and Y, even if A has a null causal effect, a zero causal effect on Y, then we say that there is bias under the null.

Original toplevel document (pdf)

cannot see any pdfs


Flashcard 7092986842380

Tags
#DAG #causal #edx
Question
We have seen that confounding is a [...] bias when we are conducting causal inference research.
Answer
systematic

statusnot learnedmeasured difficulty37% [default]last interval [days]               
repetition number in this series0memorised on               scheduled repetition               
scheduled repetition interval               last repetition or drill

Parent (intermediate) annotation

Open it
We have seen that confounding is a systematic bias when we are conducting causal inference research.
Original toplevel document (pdf)

cannot see any pdfs