Edited, memorised or added to reading queue
on 17-Dec-2016 (Sat)
Do you want BuboFlash to help you learning these things? Click here to log in or create user.
Flashcard 1402094882060
| status | not learned | measured difficulty | 37% [default] | last interval [days] | |||
|---|---|---|---|---|---|---|---|
| repetition number in this series | 0 | memorised on | scheduled repetition | ||||
| scheduled repetition interval | last repetition or drill |
Flashcard 1425573022988
| status | not learned | measured difficulty | 37% [default] | last interval [days] | |||
|---|---|---|---|---|---|---|---|
| repetition number in this series | 0 | memorised on | scheduled repetition | ||||
| scheduled repetition interval | last repetition or drill |
Parent (intermediate) annotation
Open itReading 15 deals with the theory of the firm, focusing on the supply of goods and services by profit-maximizing firms. That reading provides the basis for understanding the cost side of firms’ profit equation.
Original toplevel document
Study Session 4quantities. Reading 14 covers the theory of the consumer, which addresses the demand for goods and services by individuals who make decisions to maximize the satisfaction they receive from present and future consumption. <span>Reading 15 deals with the theory of the firm, focusing on the supply of goods and services by profit-maximizing firms. That reading provides the basis for understanding the cost side of firms’ profit equation. Reading 16 completes the picture by addressing revenue and explains the types of markets in which firms sell output. Overall, the study session provides the economic tools fo
Flashcard 1425611820300
| status | not learned | measured difficulty | 37% [default] | last interval [days] | |||
|---|---|---|---|---|---|---|---|
| repetition number in this series | 0 | memorised on | scheduled repetition | ||||
| scheduled repetition interval | last repetition or drill |
Parent (intermediate) annotation
Open itThis reading is organized as follows. Section 2 explains how economists classify markets. Section 3 covers the basic principles and concepts of demand and supply analysis of markets. Section 4 introduces measures of sensitivity of demand to changes in
Original toplevel document
1. INTRODUCTIONs to converge to an equilibrium price? What are the conditions that would make that equilibrium stable or unstable in response to external shocks? How do different types of auctions affect price discovery? <span>This reading is organized as follows. Section 2 explains how economists classify markets. Section 3 covers the basic principles and concepts of demand and supply analysis of markets. Section 4 introduces measures of sensitivity of demand to changes in prices and income. A summary and practice problems conclude the reading. <span><body><html>
| status | not read | reprioritisations | ||
|---|---|---|---|---|
| last reprioritisation on | suggested re-reading day | |||
| started reading on | finished reading on |
Parent (intermediate) annotation
Open itAn important concept in the market model is market equilibrium , defined as the condition in which the quantity willingly offered for sale by sellers at a given price is just equal to the quantity willingly demanded by buyers at that same price. When that condition is met, we say that the market has discovered its equilibrium price. An alternative and equivalent condition of equilibrium occurs at that quantity at which the high
Original toplevel document
3.6. Market EquilibriumAn important concept in the market model is market equilibrium , defined as the condition in which the quantity willingly offered for sale by sellers at a given price is just equal to the quantity willingly demanded by buyers at that same price. When that condition is met, we say that the market has discovered its equilibrium price. An alternative and equivalent condition of equilibrium occurs at that quantity at which the highest price a buyer is willing to pay is just equal to the lowest price a seller is willing to accept for that same quantity. As we have discovered in the earlier sections, the demand curve shows (for given values of income, other prices, etc.) an infinite number of combinations of prices and qua
| status | not read | reprioritisations | ||
|---|---|---|---|---|
| last reprioritisation on | suggested re-reading day | |||
| started reading on | finished reading on |
3.6. Market Equilibrium
e of the demand and supply model of this particular market. Because of that, they are called exogenous variables . Price and quantity, however, are determined within the model for this particular market and are called endogenous variables . <span>In our simple example, there are three exogenous variables (I, P y , and W) and three endogenous variables: P x , Qdx , and Qsx . Hence, we have a system of two equations and three unknowns. We need another equation to solve this system. That equation is called the equilibrium condition , and it is simply Qdx=Qsx . Continuing with our hypothetical examples, we could assume that income equals $50 (thousand, per year), the price of automobiles equals $20 (thousand, per automobile), and
| status | not read | reprioritisations | ||
|---|---|---|---|---|
| last reprioritisation on | suggested re-reading day | |||
| started reading on | finished reading on |
3.11. Total Surplus—Total Value minus Total Variable Cost
equilibrium and total surplus, represented as the area of the shaded triangle. The area of that triangle is the difference between the trapezoid of total value to society’s buyers and the trapezoid of total resource cost to society’s sellers. <span>If price measures dollars (or euros) per unit, and quantity measures units per month, then the measure of total surplus is dollars (euros) per month. It is the “bargain” that buyers and sellers together experience when they voluntarily trade the good in a market. If the market ceased to exist, that would be the monetary value of the loss to society. Exhibit 14. Total Surplus as the Area beneath the Demand Curve and above the Supply Curve <span><body><html>
| status | not read | reprioritisations | ||
|---|---|---|---|---|
| last reprioritisation on | suggested re-reading day | |||
| started reading on | finished reading on |
3.13. Market Interference: The Negative Impact on Total Surplus
Sometimes, lawmakers determine that the market price is “too high” for consumers to pay, so they use their power to impose a ceiling on price below the market equilibrium price. Some examples of ceilings include rent controls (limits on increases in the rent paid for apartments), limits on the prices of medicines, and laws against “price gouging” after a hurricane (i.e., charging opportunistically high prices for goods such as bottled water or plywood). Certainly, price limits benefit anyone who had been paying the old higher price and can still buy all they want at the lower ceiling price. However, the story is more complicated than that. Exhibit 16 shows a market in which a ceiling price, P c , has been imposed below equilibrium. Let’s examine the full impact of such a law. Exhibit 16. A Price Ceiling&
Flashcard 1427363990796
| status | not learned | measured difficulty | 37% [default] | last interval [days] | |||
|---|---|---|---|---|---|---|---|
| repetition number in this series | 0 | memorised on | scheduled repetition | ||||
| scheduled repetition interval | last repetition or drill |
Parent (intermediate) annotation
Open itSouth Korean President Park Geun-hye, who's been impeached with an overwhelming majority of votes in parliament.
Original toplevel document
5 things you need to know to start your dayo was today little changed. Next week, attention shifts to the U.S. Federal Reserve, with anything less than a rate hike constituting a major upset. Park out Another day, another world leader toppled. This time, it's <span>South Korean President Park Geun-hye, who's been impeached with an overwhelming majority of votes in parliament. That means she's been suspended from power until the constitutional court rules on the lawmakers' decision. It must do so within six months, which would then start the clock for an elec
Flashcard 1428168772876
| status | not learned | measured difficulty | 37% [default] | last interval [days] | |||
|---|---|---|---|---|---|---|---|
| repetition number in this series | 0 | memorised on | scheduled repetition | ||||
| scheduled repetition interval | last repetition or drill |
Parent (intermediate) annotation
Open itAlthough a good’s own price is important in determining consumers’ willingness to purchase it, other variables also have influence on that decision, such as consumers’ incomes, their tastes and preferences, the prices of other goods that serve as substitutes or complements, and so on. Economists attempt to capture all of these influences in a relationship called the demand function .</spa
Original toplevel document
3.1. The Demand Function and the Demand Curveyers will choose to buy less of it, and as its price falls, they buy more. This is such a ubiquitous observation that it has come to be called the law of demand , although we shall see that it need not hold in all circumstances. <span>Although a good’s own price is important in determining consumers’ willingness to purchase it, other variables also have influence on that decision, such as consumers’ incomes, their tastes and preferences, the prices of other goods that serve as substitutes or complements, and so on. Economists attempt to capture all of these influences in a relationship called the demand function . (In general, a function is a relationship that assigns a unique value to a dependent variable for any given set of values of a group of independent variables.) We represent such a deman
Flashcard 1428853493004
| status | not learned | measured difficulty | 37% [default] | last interval [days] | |||
|---|---|---|---|---|---|---|---|
| repetition number in this series | 0 | memorised on | scheduled repetition | ||||
| scheduled repetition interval | last repetition or drill |
Parent (intermediate) annotation
Open itIn the second case, called a private value auction , each buyer places a subjective value on the item, and in general their values differ. An example might be an auction for a unique piece of art that buyers are hoping to purchase for t
Original toplevel document
3.8. Auctions as a Way to Find Equilibrium Pricetrue value. An example of a common value auction would be bidding on a jar containing many coins. Each bidder could estimate the value; but until someone buys the jar and actually counts the coins, no one knows with certainty the true value. <span>In the second case, called a private value auction , each buyer places a subjective value on the item, and in general their values differ. An example might be an auction for a unique piece of art that buyers are hoping to purchase for their own personal enjoyment, not primarily as an investment to be sold later. Auctions also differ according to the mechanism used to arrive at a price and to determine the ultimate buyer. These mechanisms include the ascending price (or English) auc
Flashcard 1428856114444
| status | not learned | measured difficulty | 37% [default] | last interval [days] | |||
|---|---|---|---|---|---|---|---|
| repetition number in this series | 0 | memorised on | scheduled repetition | ||||
| scheduled repetition interval | last repetition or drill |
Parent (intermediate) annotation
Open itEn conclusión, el deber es simplemente el carácter obligatorio de las exigencias morales y el deber jurídico es la presión que el Estado impone para el cumplimiento de una norma que tiene carácter sancionador, tan es así que el hombre debe acatar determinados manda
Original toplevel document (pdf)
cannot see any pdfsFlashcard 1429067402508
| status | not learned | measured difficulty | 37% [default] | last interval [days] | |||
|---|---|---|---|---|---|---|---|
| repetition number in this series | 0 | memorised on | scheduled repetition | ||||
| scheduled repetition interval | last repetition or drill |
Parent (intermediate) annotation
Open itThese arts of reading, writing, and reckoning have formed the traditional basis of liberal education, each constituting both a field of knowledge and the technique t o acquire that knowledge.
Original toplevel document (pdf)
cannot see any pdfsFlashcard 1429102005516
| status | not learned | measured difficulty | 37% [default] | last interval [days] | |||
|---|---|---|---|---|---|---|---|
| repetition number in this series | 0 | memorised on | scheduled repetition | ||||
| scheduled repetition interval | last repetition or drill |
Parent (intermediate) annotation
Open itRhetoric is the master art of the trivium, 12 for it presupposes and makes use of grammar and logic; it is the art of communicating through symbols ideas about reality</htm
Original toplevel document (pdf)
cannot see any pdfsFlashcard 1429130317068
| status | not learned | measured difficulty | 37% [default] | last interval [days] | |||
|---|---|---|---|---|---|---|---|
| repetition number in this series | 0 | memorised on | scheduled repetition | ||||
| scheduled repetition interval | last repetition or drill |
Parent (intermediate) annotation
Open ithumans alone among animals have the power to think. Consequently, they alone have language in the proper sense of the word. 1 This follows from their nature, for they are rational and therefore have something to say, social and therefore have someone to say it to, and animal and therefore require a physical mode of communicating ideas from one mind, which
Original toplevel document (pdf)
cannot see any pdfsFlashcard 1429240941836
| status | not learned | measured difficulty | 37% [default] | last interval [days] | |||
|---|---|---|---|---|---|---|---|
| repetition number in this series | 0 | memorised on | scheduled repetition | ||||
| scheduled repetition interval | last repetition or drill |
Parent (intermediate) annotation
Open itle experience a rise in income, they buy absolutely less of some goods, and they buy more when their income falls. Hence, income elasticity of demand for those goods is negative. By definition, goods with negative income elasticity are called <span>inferior goods .<span><body><html>
Original toplevel document
4.3. Income Elasticity of Demand: Normal and Inferior Goodsthat the demand for that particular good rises when income increases and falls when income decreases. Hence, if we find that when income rises, people buy more meals at restaurants, then dining out is defined to be a normal good. <span>For some goods, there is an inverse relationship between quantity demanded and consumer income. That is, when people experience a rise in income, they buy absolutely less of some goods, and they buy more when their income falls. Hence, income elasticity of demand for those goods is negative. By definition, goods with negative income elasticity are called inferior goods . Again, the word inferior means nothing other than that the income elasticity of demand for that good is observed to be negative. It does not necessarily indicate anything at all about t
Flashcard 1430302100748
| status | not learned | measured difficulty | 37% [default] | last interval [days] | |||
|---|---|---|---|---|---|---|---|
| repetition number in this series | 0 | memorised on | scheduled repetition | ||||
| scheduled repetition interval | last repetition or drill |
Parent (intermediate) annotation
Open itBased on algebraic sign and magnitude of the various elasticities, goods can be classified into groups. If own-price elasticity of demand is less than one in absolute value, demand is called “inelastic”; it is called “elastic” if own-price elasticity of demand is greater than one in absolute value. Goods with positive income elasticity of demand are called normal goods, and those with
Original toplevel document
SUMMARYhe dependent variable to the percentage change in the independent variable of interest. Important specific elasticities include own-price elasticity of demand, income elasticity of demand, and cross-price elasticity of demand. <span>Based on algebraic sign and magnitude of the various elasticities, goods can be classified into groups. If own-price elasticity of demand is less than one in absolute value, demand is called “inelastic”; it is called “elastic” if own-price elasticity of demand is greater than one in absolute value. Goods with positive income elasticity of demand are called normal goods, and those with negative income elasticity of demand are called inferior goods. Two goods with negative cross-price elasticity of demand—a drop in the price of one good causes an increase in demand for the other good—are called complements. Goods with positive cross-price elasticity of demand—a drop in the price of one good causes a decrease in demand for the other—are called substitutes. The relationship among own-price elasticity of demand, changes in price, and changes in total expenditure is as follows: If demand is elastic, a reduction in price resul
Flashcard 1430334082316
| status | not learned | measured difficulty | 37% [default] | last interval [days] | |||
|---|---|---|---|---|---|---|---|
| repetition number in this series | 0 | memorised on | scheduled repetition | ||||
| scheduled repetition interval | last repetition or drill |
Parent (intermediate) annotation
Open itA change in a good’s own-price causes a movement along the demand curve, this is referred to as a change in quantity demanded, A change in the value of any other variable will shift the entire demand curve. This is referred to as a <span>change in demand.<span><body><html>
Original toplevel document
Open itbut the intercepts have both increased, resulting in an outward shift in the demand curve, as shown in Exhibit 2. Exhibit 2. Household Demand Curve for Gasoline before and after Change in Income <span>In general, the only thing that can cause a movement along the demand curve is a change in a good’s own-price. A change in the value of any other variable will shift the entire demand curve. The former is referred to as a change in quantity demanded, and the latter is referred to as a change in demand. More importantly, the shift in demand was both a vertical shift upward and a horizontal shift to the right. That is to say, for any given quantity, the household is now wil
Flashcard 1430336965900
| status | not learned | measured difficulty | 37% [default] | last interval [days] | |||
|---|---|---|---|---|---|---|---|
| repetition number in this series | 0 | memorised on | scheduled repetition | ||||
| scheduled repetition interval | last repetition or drill |
Parent (intermediate) annotation
Open itThe graph of the inverse supply function is called the supply curve , and it shows simultaneously the highest quantity willingly supplied at each price and the lowest price willingly accepted for each quantity.
Original toplevel document
3.3. The Supply Function and the Supply Curvenly the two variables Qsx and P x appear. Once again, we can solve this equation for P x in terms of Qsx , which yields the inverse supply function in Equation 10: Equation (10) P x = 1 + 0.004Q x <span>The graph of the inverse supply function is called the supply curve , and it shows simultaneously the highest quantity willingly supplied at each price and the lowest price willingly accepted for each quantity. For example, if the price of gasoline were $3 per gallon, Equation 9 implies that this seller would be willing to sell 500 gallons per week. Alternatively, the lowest price she would ac
Flashcard 1430338538764
| status | not learned | measured difficulty | 37% [default] | last interval [days] | |||
|---|---|---|---|---|---|---|---|
| repetition number in this series | 0 | memorised on | scheduled repetition | ||||
| scheduled repetition interval | last repetition or drill |
Parent (intermediate) annotation
Open itity are determined outside of the demand and supply model of this particular market. Because of that, they are called exogenous variables . Price and quantity, however, are determined within the model for this particular market and are called <span>endogenous variables<span><body><html>
Original toplevel document
3.6. Market Equilibriumal gasoline market, the demand function was given by Qdx=f(Px,I,Py) , and the supply function was given by Qsx=f(Px,W) . Those expressions are called behavioral equations because they model the behavior of, respectively, buyers and sellers. <span>Variables other than own price and quantity are determined outside of the demand and supply model of this particular market. Because of that, they are called exogenous variables . Price and quantity, however, are determined within the model for this particular market and are called endogenous variables . In our simple example, there are three exogenous variables (I, P y , and W) and three endogenous variables: P x , Qdx , and Qsx . Hence, we have a system of two equations and three un
Flashcard 1430341684492
| status | not learned | measured difficulty | 37% [default] | last interval [days] | |||
|---|---|---|---|---|---|---|---|
| repetition number in this series | 0 | memorised on | scheduled repetition | ||||
| scheduled repetition interval | last repetition or drill |
Parent (intermediate) annotation
Open itand three endogenous variables: P x , Qdx , and Qsx . Hence, we have a system of two equations and three unknowns. We need another equation to solve this system. That equation is called the equilibrium condition , and it is simply <span>Qdx=Qsx .<span><body><html>
Original toplevel document
3.6. Market Equilibriume of the demand and supply model of this particular market. Because of that, they are called exogenous variables . Price and quantity, however, are determined within the model for this particular market and are called endogenous variables . <span>In our simple example, there are three exogenous variables (I, P y , and W) and three endogenous variables: P x , Qdx , and Qsx . Hence, we have a system of two equations and three unknowns. We need another equation to solve this system. That equation is called the equilibrium condition , and it is simply Qdx=Qsx . Continuing with our hypothetical examples, we could assume that income equals $50 (thousand, per year), the price of automobiles equals $20 (thousand, per automobile), and
Flashcard 1430343257356
| status | not learned | measured difficulty | 37% [default] | last interval [days] | |||
|---|---|---|---|---|---|---|---|
| repetition number in this series | 0 | memorised on | scheduled repetition | ||||
| scheduled repetition interval | last repetition or drill |
Parent (intermediate) annotation
Open itWhen we concentrate on one market, taking values of exogenous variables as given, we are engaging in what is called partial equilibrium analysis
Original toplevel document
3.6. Market Equilibriumuantity. Conceptually, the values of the exogenous variables are being determined in other markets, such as the markets for labor, automobiles, and so on, whereas the price and quantity of gasoline are being determined in the gasoline market. <span>When we concentrate on one market, taking values of exogenous variables as given, we are engaging in what is called partial equilibrium analysis . In many cases, we can gain sufficient insight into a market of interest without addressing feedback effects to and from all the other markets that are tangentially involved with this
Flashcard 1430344830220
| status | not learned | measured difficulty | 37% [default] | last interval [days] | |||
|---|---|---|---|---|---|---|---|
| repetition number in this series | 0 | memorised on | scheduled repetition | ||||
| scheduled repetition interval | last repetition or drill |
Parent (intermediate) annotation
Open itTo reach equilibrium, price must adjust until there is neither an excess supply nor an excess demand. That adjustment is called the market mechanism , and it is characterized in the following way: In the case of excess supply, price will fall; in the case of excess demand, price will rise; and in the case of neither excess supply no
Original toplevel document
3.7. The Market Mechanism: Iterating toward Equilibrium—or Nott buyers are willing to purchase 5,400 more units than sellers are willing to offer. This result is shown in Exhibit 9. Exhibit 9. Excess Demand as a Consequence of Price below Equilibrium Price <span>To reach equilibrium, price must adjust until there is neither an excess supply nor an excess demand. That adjustment is called the market mechanism , and it is characterized in the following way: In the case of excess supply, price will fall; in the case of excess demand, price will rise; and in the case of neither excess supply nor excess demand, price will not change. EXAMPLE 7 Identifying Excess Demand or Excess Supply at a Non-equilibrium Price In the local market for e-books, the aggregate demand i
Flashcard 1430346665228
| status | not learned | measured difficulty | 37% [default] | last interval [days] | |||
|---|---|---|---|---|---|---|---|
| repetition number in this series | 0 | memorised on | scheduled repetition | ||||
| scheduled repetition interval | last repetition or drill |
Parent (intermediate) annotation
Open ittotal surplus is made up of the sum of consumer surplus and producer surplus.
Original toplevel document
3.11. Total Surplus—Total Value minus Total Variable Cost, for every one of those units, sellers would have been willing to sell it for less than they actually received. The total value to buyers was greater than the total variable cost to sellers. The difference between those two values is called <span>total surplus , and it is made up of the sum of consumer surplus and producer surplus. Note that the way the total surplus is divided between consumers and producers depends on the steepness of the demand and supply curves. If the supply curve is steeper than the demand c
| status | not read | reprioritisations | ||
|---|---|---|---|---|
| last reprioritisation on | suggested re-reading day | |||
| started reading on | finished reading on |
Parent (intermediate) annotation
Open itNote that the way the total surplus is divided between consumers and producers depends on the steepness of the demand and supply curves. If the supply curve is steeper than the demand curve, more of the surplus is being captured by producers. If the demand curve is steeper, consumers capture more of the surplus.
Original toplevel document
3.11. Total Surplus—Total Value minus Total Variable Costn they actually received. The total value to buyers was greater than the total variable cost to sellers. The difference between those two values is called total surplus , and it is made up of the sum of consumer surplus and producer surplus. <span>Note that the way the total surplus is divided between consumers and producers depends on the steepness of the demand and supply curves. If the supply curve is steeper than the demand curve, more of the surplus is being captured by producers. If the demand curve is steeper, consumers capture more of the surplus. In a fundamental sense, total surplus is a measure of society’s gain from the voluntary exchange of goods and services. Whenever total surplus increases, society gains. An
Flashcard 1430349810956
| status | not learned | measured difficulty | 37% [default] | last interval [days] | |||
|---|---|---|---|---|---|---|---|
| repetition number in this series | 0 | memorised on | scheduled repetition | ||||
| scheduled repetition interval | last repetition or drill |
Parent (intermediate) annotation
Open itIf the supply curve is steeper than the demand curve, more of the surplus is being captured by producers. If the demand curve is steeper, consumers capture more of the surplus.
Original toplevel document
3.11. Total Surplus—Total Value minus Total Variable Costn they actually received. The total value to buyers was greater than the total variable cost to sellers. The difference between those two values is called total surplus , and it is made up of the sum of consumer surplus and producer surplus. <span>Note that the way the total surplus is divided between consumers and producers depends on the steepness of the demand and supply curves. If the supply curve is steeper than the demand curve, more of the surplus is being captured by producers. If the demand curve is steeper, consumers capture more of the surplus. In a fundamental sense, total surplus is a measure of society’s gain from the voluntary exchange of goods and services. Whenever total surplus increases, society gains. An
Flashcard 1430352170252
| status | not learned | measured difficulty | 37% [default] | last interval [days] | |||
|---|---|---|---|---|---|---|---|
| repetition number in this series | 0 | memorised on | scheduled repetition | ||||
| scheduled repetition interval | last repetition or drill |
Parent (intermediate) annotation
Open itAn important result of market equilibrium is that total surplus is maximized at the equilibrium price and quantity.
Original toplevel document
3.11. Total Surplus—Total Value minus Total Variable Costand curve is steeper, consumers capture more of the surplus. In a fundamental sense, total surplus is a measure of society’s gain from the voluntary exchange of goods and services. Whenever total surplus increases, society gains. <span>An important result of market equilibrium is that total surplus is maximized at the equilibrium price and quantity. Exhibit 14 combines the supply curve and the demand curve to show market equilibrium and total surplus, represented as the area of the shaded triangle. The area of that triangle is the
Flashcard 1430355315980
| status | not learned | measured difficulty | 37% [default] | last interval [days] | |||
|---|---|---|---|---|---|---|---|
| repetition number in this series | 0 | memorised on | scheduled repetition | ||||
| scheduled repetition interval | last repetition or drill |
Parent (intermediate) annotation
Open itIf price measures dollars per unit, and quantity measures units per month, then the measure of total surplus is dollars per month. Total Surplus, If the market ceased to exist, would be the monetary value of the loss to society.
Original toplevel document
3.11. Total Surplus—Total Value minus Total Variable Costequilibrium and total surplus, represented as the area of the shaded triangle. The area of that triangle is the difference between the trapezoid of total value to society’s buyers and the trapezoid of total resource cost to society’s sellers. <span>If price measures dollars (or euros) per unit, and quantity measures units per month, then the measure of total surplus is dollars (euros) per month. It is the “bargain” that buyers and sellers together experience when they voluntarily trade the good in a market. If the market ceased to exist, that would be the monetary value of the loss to society. Exhibit 14. Total Surplus as the Area beneath the Demand Curve and above the Supply Curve <span><body><html>
Flashcard 1430357937420
| status | not learned | measured difficulty | 37% [default] | last interval [days] | |||
|---|---|---|---|---|---|---|---|
| repetition number in this series | 0 | memorised on | scheduled repetition | ||||
| scheduled repetition interval | last repetition or drill |
Parent (intermediate) annotation
Open itIf price measures dollars per unit, and quantity measures units per month, then the measure of total surplus is dollars per month. Total Surplus, If the market ceased to exist, would be the monetary value of the loss to society.
Original toplevel document
3.11. Total Surplus—Total Value minus Total Variable Costequilibrium and total surplus, represented as the area of the shaded triangle. The area of that triangle is the difference between the trapezoid of total value to society’s buyers and the trapezoid of total resource cost to society’s sellers. <span>If price measures dollars (or euros) per unit, and quantity measures units per month, then the measure of total surplus is dollars (euros) per month. It is the “bargain” that buyers and sellers together experience when they voluntarily trade the good in a market. If the market ceased to exist, that would be the monetary value of the loss to society. Exhibit 14. Total Surplus as the Area beneath the Demand Curve and above the Supply Curve <span><body><html>
Flashcard 1430360296716
| status | not learned | measured difficulty | 37% [default] | last interval [days] | |||
|---|---|---|---|---|---|---|---|
| repetition number in this series | 0 | memorised on | scheduled repetition | ||||
| scheduled repetition interval | last repetition or drill |
Parent (intermediate) annotation
Open itAn externality is a case in which production costs or the consumption benefits of a good or service spill over onto those who are not producing or consuming the good or service; a spillover cost (e.g.
Original toplevel document
3.12. Markets Maximize Society’s Total Surplusof a good. Hence, it is society’s marginal value curve for that good. Additionally, the market supply curve represents the marginal cost to society to produce each additional unit of that good, assuming no positive or negative externalities. (<span>An externality is a case in which production costs or the consumption benefits of a good or service spill over onto those who are not producing or consuming the good or service; a spillover cost (e.g., pollution) is called a negative externality , a spillover benefit (e.g., literacy programs) is called a positive externality .) At equilibrium, where demand and supply curves intersect, the highest price that someone is willing to pay is just equal to the lowest price that a seller is willing to acc
Flashcard 1430362656012
| status | not learned | measured difficulty | 37% [default] | last interval [days] | |||
|---|---|---|---|---|---|---|---|
| repetition number in this series | 0 | memorised on | scheduled repetition | ||||
| scheduled repetition interval | last repetition or drill |
Parent (intermediate) annotation
Open itAn externality is a case in which production costs or the consumption benefits of a good or service spill over onto those who are not producing or consuming the good or service; a spillover cost (e.g., pollution) is called a negative externality , a spillover benefit (e.g., literacy programs) is called a positive externality .)<html>
Original toplevel document
3.12. Markets Maximize Society’s Total Surplusof a good. Hence, it is society’s marginal value curve for that good. Additionally, the market supply curve represents the marginal cost to society to produce each additional unit of that good, assuming no positive or negative externalities. (<span>An externality is a case in which production costs or the consumption benefits of a good or service spill over onto those who are not producing or consuming the good or service; a spillover cost (e.g., pollution) is called a negative externality , a spillover benefit (e.g., literacy programs) is called a positive externality .) At equilibrium, where demand and supply curves intersect, the highest price that someone is willing to pay is just equal to the lowest price that a seller is willing to acc
Flashcard 1430365801740
| status | not learned | measured difficulty | 37% [default] | last interval [days] | |||
|---|---|---|---|---|---|---|---|
| repetition number in this series | 0 | memorised on | scheduled repetition | ||||
| scheduled repetition interval | last repetition or drill |
Parent (intermediate) annotation
Open itmption benefits of a good or service spill over onto those who are not producing or consuming the good or service; a spillover cost (e.g., pollution) is called a negative externality , a spillover benefit (e.g., literacy programs) is called a <span>positive externality .)<span><body><html>
Original toplevel document
3.12. Markets Maximize Society’s Total Surplusof a good. Hence, it is society’s marginal value curve for that good. Additionally, the market supply curve represents the marginal cost to society to produce each additional unit of that good, assuming no positive or negative externalities. (<span>An externality is a case in which production costs or the consumption benefits of a good or service spill over onto those who are not producing or consuming the good or service; a spillover cost (e.g., pollution) is called a negative externality , a spillover benefit (e.g., literacy programs) is called a positive externality .) At equilibrium, where demand and supply curves intersect, the highest price that someone is willing to pay is just equal to the lowest price that a seller is willing to acc
| status | not read | reprioritisations | ||
|---|---|---|---|---|
| last reprioritisation on | suggested re-reading day | |||
| started reading on | finished reading on |
| status | not read | reprioritisations | ||
|---|---|---|---|---|
| last reprioritisation on | suggested re-reading day | |||
| started reading on | finished reading on |
Molecular mechanisms involved in the side effects of fatty acid amide hydrolase inhibitors: a structural phenomics approach to proteome-wide cellular off-target deconvolution and disease association : npj Systems Biology and Applications
inding profile in the cellular context and on a structural proteome scale, and investigate the roles of these off-targets in impacting human physiology and pathology using text mining-based phenomics analysis. Using this integrative approach, <span>we discover that FAAH inhibitors may bind to the dimerization interface of NMDA receptor (NMDAR) and several other BAs, and thus disrupt their cellular functions. Specifically, the malfunction of the NMDAR is associated with a wide spectrum of brain disorders that are directly related to the observed side effects of FAAH inhibitors. This finding
| status | not read | reprioritisations | ||
|---|---|---|---|---|
| last reprioritisation on | suggested re-reading day | |||
| started reading on | finished reading on |
Molecular mechanisms involved in the side effects of fatty acid amide hydrolase inhibitors: a structural phenomics approach to proteome-wide cellular off-target deconvolution and disease association : npj Systems Biology and Applications
and link BA–ligand interaction with clinical outcomes, can be valuable in off-target screening. The development and application of such methods will accelerate the development of more safe and effective therapeutics. IntroductionIntroduction <span>Fatty acid amide hydrolase (FAAH) is an enzyme involved in the hydrolysis of bioactive lipids such as anandamide, 2-arachidonoylglycerol (2-AG) and oleamide. 1 It is distributed in several of the major organs of the human body, but is also regionally distributed in the brain where it is believed to correlate with cannibinoid receptors. 2 I
| status | not read | reprioritisations | ||
|---|---|---|---|---|
| last reprioritisation on | suggested re-reading day | |||
| started reading on | finished reading on |
Molecular mechanisms involved in the side effects of fatty acid amide hydrolase inhibitors: a structural phenomics approach to proteome-wide cellular off-target deconvolution and disease association : npj Systems Biology and Applications
the development of more safe and effective therapeutics. IntroductionIntroduction Fatty acid amide hydrolase (FAAH) is an enzyme involved in the hydrolysis of bioactive lipids such as anandamide, 2-arachidonoylglycerol (2-AG) and oleamide. 1 <span>It is distributed in several of the major organs of the human body, but is also regionally distributed in the brain where it is believed to correlate with cannibinoid receptors. 2 In particular, it is believed that the overexpression of FAAH reduces the production of known endogenous cannabinoids, specifically, anandamide (AEA) and 2-arachidonoylglycerol (2-A
| status | not read | reprioritisations | ||
|---|---|---|---|---|
| last reprioritisation on | suggested re-reading day | |||
| started reading on | finished reading on |
Molecular mechanisms involved in the side effects of fatty acid amide hydrolase inhibitors: a structural phenomics approach to proteome-wide cellular off-target deconvolution and disease association : npj Systems Biology and Applications
. 1 It is distributed in several of the major organs of the human body, but is also regionally distributed in the brain where it is believed to correlate with cannibinoid receptors. 2 In particular, it is believed that the overexpression of <span>FAAH reduces the production of known endogenous cannabinoids, specifically, anandamide (AEA) and 2-arachidonoylglycerol (2-AG). 3 This makes FAAH an attractive drug target, as inhibition of FAAH would, through the upregulation of AEA and 2-AG, elicit the effects of cannabinoid activation. Thus, FAAH inhibitors
| status | not read | reprioritisations | ||
|---|---|---|---|---|
| last reprioritisation on | suggested re-reading day | |||
| started reading on | finished reading on |
Molecular mechanisms involved in the side effects of fatty acid amide hydrolase inhibitors: a structural phenomics approach to proteome-wide cellular off-target deconvolution and disease association : npj Systems Biology and Applications
rticular, it is believed that the overexpression of FAAH reduces the production of known endogenous cannabinoids, specifically, anandamide (AEA) and 2-arachidonoylglycerol (2-AG). 3 This makes FAAH an attractive drug target, as inhibition of <span>FAAH would, through the upregulation of AEA and 2-AG, elicit the effects of cannabinoid activation. Thus, FAAH inhibitors may serve as analgesic, anti-inflammatory, anxiolytic and antidepressant therapeutics. 4 However, the development of potent and safe FAAH inhibitors is hindered by their possible serious side effects. 5 In a recent clinical trial, the FAAH inhibitor BIA 10-2474, caused c
| status | not read | reprioritisations | ||
|---|---|---|---|---|
| last reprioritisation on | suggested re-reading day | |||
| started reading on | finished reading on |
Molecular mechanisms involved in the side effects of fatty acid amide hydrolase inhibitors: a structural phenomics approach to proteome-wide cellular off-target deconvolution and disease association : npj Systems Biology and Applications
t time, we develop a structural phenomics approach, which integrates heterogeneous data from structural genomics, chemical genomics and the biomedical literature, to reveal the cellular and physiological mechanism of drug–target interactions. <span>First, we screen potential cellular off-targets of FAAH inhibitors on a structural proteome using BAs that represent the functional form of proteins in the cell. Few computational methods that can screen a compound against the structural proteome-wide BAs, including uncharacterized binding sites, are available. To our knowledge, the method in th
| status | not read | reprioritisations | ||
|---|---|---|---|---|
| last reprioritisation on | suggested re-reading day | |||
| started reading on | finished reading on |
Molecular mechanisms involved in the side effects of fatty acid amide hydrolase inhibitors: a structural phenomics approach to proteome-wide cellular off-target deconvolution and disease association : npj Systems Biology and Applications
el, which combines tools derived from bioinformatics, systems biology, protein–ligand docking, MD (molecular dynamics) simulation and text mining, and integrates data from structural genomics, chemical genomics and literature. Full size image <span>Given a drug D and its primary target T (in this case, FAAH), all BAs in the Protein Data Bank (PDB; 12 both monomer and oligomer), are compared with the ligand-binding site of T using software SMAP. 13,14,15 If a BA has statistically significantly similar binding site to that of T, it may be the putative off-target of D. In addition, the electrostatic potentials of the binding sites of primary target and off-target are compared to further verify the putative binding promiscuity. Known inhibitors of T and their decoys are extracted from ChEMBL, 16 and docked into T, and its putative off-targets, respectively, using protein–ligand docking software Autodock Vina. 17 The distributions of docking scores of inhibitors and decoys are analyzed to verify the prediction from step 1. Then, molecular dynamics simulation is performed to characterize the conformational dynamics of the putative off-target–ligand interactions. The concepts of genes/proteins and diseases in from PubMed abstracts (up to July 2014) are mapped to a vector space using a deep learning technique, Word2Vec. 18 Semantic relations between the putative off-target and diseases are determined using the cosine similarity between vectors. Structural proteome-wide ligand-binding site similarity of protein BAs An increasing body of evidence supports the concept that protein fold and binding site spaces are continuous. 14,1
| status | not read | reprioritisations | ||
|---|---|---|---|---|
| last reprioritisation on | suggested re-reading day | |||
| started reading on | finished reading on |
Molecular mechanisms involved in the side effects of fatty acid amide hydrolase inhibitors: a structural phenomics approach to proteome-wide cellular off-target deconvolution and disease association : npj Systems Biology and Applications
experimental data set of the FAAH inhibitors. The binding score represents the strength of the interaction of the ligand to the binding pocket, in kcal/mol. Therefore, a more negative score indicates a more favorable and stronger interaction. <span>It is well known that the docking score is not reliable enough to predict whether a molecule is a true or false binder. The correlation analysis of docking scores of a set of molecules between the primary target and the off-target may provide more reliable information on the binding cross-reactivity. 30 Although the absolute docking scores themselves are not accurate, they will be relatively similar to each other in similar binding sites. Thus, the docking scores will be linearly
| status | not read | reprioritisations | ||
|---|---|---|---|---|
| last reprioritisation on | suggested re-reading day | |||
| started reading on | finished reading on |
| status | not read | reprioritisations | ||
|---|---|---|---|---|
| last reprioritisation on | suggested re-reading day | |||
| started reading on | finished reading on |
| status | not read | reprioritisations | ||
|---|---|---|---|---|
| last reprioritisation on | suggested re-reading day | |||
| started reading on | finished reading on |
| status | not read | reprioritisations | ||
|---|---|---|---|---|
| last reprioritisation on | suggested re-reading day | |||
| started reading on | finished reading on |
Flashcard 1430402239756
| status | not learned | measured difficulty | 37% [default] | last interval [days] | |||
|---|---|---|---|---|---|---|---|
| repetition number in this series | 0 | memorised on | scheduled repetition | ||||
| scheduled repetition interval | last repetition or drill |
| status | not read | reprioritisations | ||
|---|---|---|---|---|
| last reprioritisation on | suggested re-reading day | |||
| started reading on | finished reading on |
| status | not read | reprioritisations | ||
|---|---|---|---|---|
| last reprioritisation on | suggested re-reading day | |||
| started reading on | finished reading on |
| status | not read | reprioritisations | ||
|---|---|---|---|---|
| last reprioritisation on | suggested re-reading day | |||
| started reading on | finished reading on |
Article 1430428454156
BMV cierra su segunda peor semana del año por temor a la economía
#17-dic-2016 #el-financiero #noticias
Ante las preocupaciones sobre el entorno económico, el Índice de Precios y Cotizaciones acumuló una caída de 3.82% esta semana, la mayor desde enero, con la que se ubicó en un nivel de 45 mil 121.39 puntos. CIUDAD DE MÉXICO.- A pesar de ser una semana corta, la caída acumulada delÍndice de Precios y Cotizaciones (IPC) es la segunda más grande en lo que va del año, luego que analistas han advertido mayores tasas de interés, más inflación y menos crecimiento en el país para 2017, lo que limitaría las ganancias corporativas. Al cierre de la sesión, el principal indicador del mercado bursátil marcó una pérdida de 1.64 por ciento, sin embargo, frente al viernes previo, la caída es de 3.82 por ciento. Con ello, el IPC se ubicó en 45 mil 121.39 unidades, casi mil 800 menos que hace una semana. Al interior de la muestra, las emisoras que tuvieron el peor desempeño en los últimos cuatro días fueron Industrias Peñoles, con un retroceso de 8.86 por ciento; Cemex, con uno de 8.58 por ciento, y Grupo México, con
| status | not read | reprioritisations | ||
|---|---|---|---|---|
| last reprioritisation on | suggested re-reading day | |||
| started reading on | finished reading on |
BMV cierra su segunda peor semana del año por temor a la economía
Ante las preocupaciones sobre el entorno económico, el Índice de Precios y Cotizaciones acumuló una caída de 3.82% esta semana, la mayor desde enero, con la que se ubicó en un nivel de 45 mil 121.39 puntos. CIUDAD DE MÉXICO.- A pesar de ser una semana corta, la caída acumulada delÍndice de Precios y Cotizaciones (IPC) es la segunda más grande en lo que va del año, luego que ana
| status | not read | reprioritisations | ||
|---|---|---|---|---|
| last reprioritisation on | suggested re-reading day | |||
| started reading on | finished reading on |
BMV cierra su segunda peor semana del año por temor a la economía
ro, con la que se ubicó en un nivel de 45 mil 121.39 puntos. CIUDAD DE MÉXICO.- A pesar de ser una semana corta, la caída acumulada delÍndice de Precios y Cotizaciones (IPC) es la segunda más grande en lo que va del año, luego que <span>analistas han advertido mayores tasas de interés, más inflación y menos crecimiento en el país para 2017, lo que limitaría las ganancias corporativas. Al cierre de la sesión, el principal indicador del mercado bursátil marcó una pérdida de 1.64 por ciento, sin embargo, frente al
| status | not read | reprioritisations | ||
|---|---|---|---|---|
| last reprioritisation on | suggested re-reading day | |||
| started reading on | finished reading on |
BMV cierra su segunda peor semana del año por temor a la economía
44 por ciento, mientras que el S&P 500 y el Nasdaq perdieron 0.06 y 0.13 por ciento, respectivamente. Durante la siguiente semana, los inversionistas estarán atentos al comportamiento del dólar en el mercado internacional, pues <span>la fortaleza de la divisa derivada del anuncio de la Reserva Federal esta semana podría aumentar la presión sobre algunas economías, principalmente las emergentes. <span><body><html>
Article 1430434745612
Obama responsabiliza al gobierno ruso del hackeo en EU y conflicto sirio
#17-dic-2016 #el-financiero #noticias
Durante la rueda de prensa, Barack Obama declaró que el gobierno ruso está detrás del hackeo llevado a cabo en las pasadas elecciones presidenciales en Estados Unidos, además lo acusó de ocasionar las masacres en Siria junto con el mismo régimen e Irán. Durante una rueda de prensa llevada a cabo en la Casa Blanca, el presidente de los Estados Unidos, Barack Obama admitió que se siente responsable de lo ocurrido en Alepo, Siria, debido a que la estrategia que se llevó a cabo para tratar de solucionar el conflicto quizás no haya funcionado. "No puedo decir que hayamos tenido éxito", admitió Obama. Aseguró también que otros responsables del conflicto en Siria son el régimen sirio, Rusia e Irán, a quienes acusa de ocultar lo que ‘realmente sucede’ y de ocasionar las masacres en esa región. En cuanto al tema del supuesto hackeo ruso en las elecciones presidenciales pasadas, Obama declaró haberle advertido durante la pasada reunió del G20 al presidente ruso, Vladimir Putin, que dejara de utilizar est
| status | not read | reprioritisations | ||
|---|---|---|---|---|
| last reprioritisation on | suggested re-reading day | |||
| started reading on | finished reading on |
Obama responsabiliza al gobierno ruso del hackeo en EU y conflicto sirio
Durante la rueda de prensa, Barack Obama declaró que el gobierno ruso está detrás del hackeo llevado a cabo en las pasadas elecciones presidenciales en Estados Unidos, además lo acusó de ocasionar las masacres en Siria junto con el mismo régimen e Irán. Durante una rueda de prensa llevada a cabo en la Casa Blanca, el presidente de los Estados Unidos, Barack Obama admitió que se siente responsable de lo ocurrido en Alepo, Si
| status | not read | reprioritisations | ||
|---|---|---|---|---|
| last reprioritisation on | suggested re-reading day | |||
| started reading on | finished reading on |
Obama responsabiliza al gobierno ruso del hackeo en EU y conflicto sirio
hackeo ruso en las elecciones presidenciales pasadas, Obama declaró haberle advertido durante la pasada reunió del G20 al presidente ruso, Vladimir Putin, que dejara de utilizar esta táctica durante las elecciones presidenciales. <span>Tras señalar que el hackeo se llevó a cabo por petición de altos niveles del gobierno ruso, el presidente Obama mencionó que su intención es mandar un mensaje directo a Rusia a modo de advertencia de posibles consecuencias en caso de que no paren estas acciones. Por otro lado, criticó el hecho de que los republicanos estén cercanos al presidente ruso, “un 37 por ciento ve a Putin de manera favorable, es decir un tercio del electorad
Article 1430439202060
Empeoran pronósticos para México en 2017
#17-dic-2016 #el-financiero #has-images #noticias
En la más reciente encuesta con analistas privados del Banco de México se revisó a la baja la previsión del PIB y al alza la inflación y el tipo de cambio. En la encuesta levantada por el Banco de México entre especialistas privados correspondiente a diciembre se revisaron a la baja los pronósticos para el 2017 del PIB y al alza el tipo de cambio e inflación. La economía de México crecerá 1.6 por ciento, desde el 1.72 por ciento pronosticado un mes antes, de acuerdo con la encuesta publicada este viernes. En cuanto al tipo de cambio se revisó a 21.21 pesos por dólar para cerrar 2017, desde 20.89 unidades. Mientras que la inflación aceleraría a 4.13 por ciento. Estos significaría que estaría por arriba del objetivo del Banco de México de 3 por ciento +/- un punto porcentual. En la encuesta de noviembre estimaban una inflación de 4.01 por ciento. Respecto a la tasa interés del Banco de México se espera crezca a 6.46 por ciento, desde el 6.38 por ciento pronosticado previamente.
| status | not read | reprioritisations | ||
|---|---|---|---|---|
| last reprioritisation on | suggested re-reading day | |||
| started reading on | finished reading on |
Empeoran pronósticos para México en 2017
En la más reciente encuesta con analistas privados del Banco de México se revisó a la baja la previsión del PIB y al alza la inflación y el tipo de cambio. En la encuesta levantada por el Banco de México entre especialistas privados correspondiente a diciembre se revisaron a la baja los pronósticos para el 2017 del PIB y
| status | not read | reprioritisations | ||
|---|---|---|---|---|
| last reprioritisation on | suggested re-reading day | |||
| started reading on | finished reading on |
Empeoran pronósticos para México en 2017
mbio. En la encuesta levantada por el Banco de México entre especialistas privados correspondiente a diciembre se revisaron a la baja los pronósticos para el 2017 del PIB y al alza el tipo de cambio e inflación. <span>La economía de México crecerá 1.6 por ciento, desde el 1.72 por ciento pronosticado un mes antes, de acuerdo con la encuesta publicada este viernes. En cuanto al tipo de cambio se revisó a 21.21 pesos por dólar para cerrar 2017, desde 20.89 unidades. Mientras que la inflación aceleraría a 4.13 por ciento. Esto
| status | not read | reprioritisations | ||
|---|---|---|---|---|
| last reprioritisation on | suggested re-reading day | |||
| started reading on | finished reading on |
Empeoran pronósticos para México en 2017
.6 por ciento, desde el 1.72 por ciento pronosticado un mes antes, de acuerdo con la encuesta publicada este viernes. En cuanto al tipo de cambio se revisó a 21.21 pesos por dólar para cerrar 2017, desde 20.89 unidades. <span>Mientras que la inflación aceleraría a 4.13 por ciento. Estos significaría que estaría por arriba del objetivo del Banco de México de 3 por ciento +/- un punto porcentual. En la encuesta de noviembre estimaban una inflación de 4.01 por ciento. Respecto a la tasa interés del Banco de México se espera crezca a 6.46 por ciento, desde
| status | not read | reprioritisations | ||
|---|---|---|---|---|
| last reprioritisation on | suggested re-reading day | |||
| started reading on | finished reading on |
Empeoran pronósticos para México en 2017
En la encuesta de noviembre estimaban una inflación de 4.01 por ciento. Respecto a la tasa interés del Banco de México se espera crezca a 6.46 por ciento, desde el 6.38 por ciento pronosticado previamente. <span>El jueves el Banco Central de México elevó elevó 50 puntos base su tasa de interés, al pasar de 5.25 por ciento a 5.75 por ciento. Es su nivel más alto desde mayo de 2009, cuando estaba en 6 por ciento. En la encuesta se consultaron a 33 grupos de análisis y consultoría económica del sector privado nacional y extranjero. Las respuestas se recibieron entre los días 6 y 14 de
Flashcard 1430452571404
| status | not learned | measured difficulty | 37% [default] | last interval [days] | |||
|---|---|---|---|---|---|---|---|
| repetition number in this series | 0 | memorised on | scheduled repetition | ||||
| scheduled repetition interval | last repetition or drill |
Parent (intermediate) annotation
Open itLas normas se clasifican en: morales, religiosas, sociales y jurídicas
Original toplevel document
Normas y asi1.3.2 Tipos de normas Las normas se clasifican en: morales, religiosas, sociales y jurídicas, como se explica en las siguientes secciones. 1.3.2.1 Normas morales Son reglas de conducta que provienen de nuestro interior, ya
Flashcard 1430455717132
| status | not learned | measured difficulty | 37% [default] | last interval [days] | |||
|---|---|---|---|---|---|---|---|
| repetition number in this series | 0 | memorised on | scheduled repetition | ||||
| scheduled repetition interval | last repetition or drill |
Parent (intermediate) annotation
Open iteconomics is the study of production, distribution, and consumption
Original toplevel document
1. INTRODUCTIONIn a general sense, economics is the study of production, distribution, and consumption and can be divided into two broad areas of study: macroeconomics and microeconomics. Macroeconomics deals with aggregate economic quantities, such as national output and national income. Macroeconomics has its roots in microeconomics , which deals with markets and d
Flashcard 1430465416460
| status | not learned | measured difficulty | 37% [default] | last interval [days] | |||
|---|---|---|---|---|---|---|---|
| repetition number in this series | 0 | memorised on | scheduled repetition | ||||
| scheduled repetition interval | last repetition or drill |
Parent (intermediate) annotation
Open itAlthough controversy remains among some economists on the empirical effects of the minimum wage, most economists continue to believe that a minimum wage can reduce employment. Although some workers will benefit, because they continue to work at the higher wage, others will be harmed because they will no longer be working at the increased wage rate.</s
Original toplevel document
3.13. Market Interference: The Negative Impact on Total Surpluslus triangle d. As a result of the floor, the buyer’s surplus is reduced to triangle a. A good example of a price floor is the imposition of a legal minimum wage in the United States, the United Kingdom, and many other countries. <span>Although controversy remains among some economists on the empirical effects of the minimum wage, most economists continue to believe that a minimum wage can reduce employment. Although some workers will benefit, because they continue to work at the higher wage, others will be harmed because they will no longer be working at the increased wage rate. EXAMPLE 11 Calculating the Amount of Deadweight Loss from a Price Floor A market has demand function given by the equation Q d = 180 –
Flashcard 1430468037900
| status | not learned | measured difficulty | 37% [default] | last interval [days] | |||
|---|---|---|---|---|---|---|---|
| repetition number in this series | 0 | memorised on | scheduled repetition | ||||
| scheduled repetition interval | last repetition or drill |
Parent (intermediate) annotation
Open itIn effect, any impediment in the dissemination of information about buyers’ and sellers’ willingness to exchange goods can cause an imbalance in demand and supply. So anything that improves that information flow can add value. In that sense, advertising can add value to the extent that it informs potential buyers of the availability of goods and
Original toplevel document
3.13. Market Interference: The Negative Impact on Total Surplusprovide value in the transaction, and for that value they are able to charge a brokerage fee. Although the brokerage fee could certainly be viewed as a transactions cost, it is really a price charged for the service of reducing search costs. <span>In effect, any impediment in the dissemination of information about buyers’ and sellers’ willingness to exchange goods can cause an imbalance in demand and supply. So anything that improves that information flow can add value. In that sense, advertising can add value to the extent that it informs potential buyers of the availability of goods and services. <span><body><html>
Flashcard 1430470397196
| status | not learned | measured difficulty | 37% [default] | last interval [days] | |||
|---|---|---|---|---|---|---|---|
| repetition number in this series | 0 | memorised on | scheduled repetition | ||||
| scheduled repetition interval | last repetition or drill |
Parent (intermediate) annotation
Open itd><head>In effect, any impediment in the dissemination of information about buyers’ and sellers’ willingness to exchange goods can cause an imbalance in demand and supply. So anything that improves that information flow can add value. In that sense, advertising can add value to the extent that it informs potential buyers of the availability of goods and services.<html>
Original toplevel document
3.13. Market Interference: The Negative Impact on Total Surplusprovide value in the transaction, and for that value they are able to charge a brokerage fee. Although the brokerage fee could certainly be viewed as a transactions cost, it is really a price charged for the service of reducing search costs. <span>In effect, any impediment in the dissemination of information about buyers’ and sellers’ willingness to exchange goods can cause an imbalance in demand and supply. So anything that improves that information flow can add value. In that sense, advertising can add value to the extent that it informs potential buyers of the availability of goods and services. <span><body><html>
Flashcard 1430472756492
| status | not learned | measured difficulty | 37% [default] | last interval [days] | |||
|---|---|---|---|---|---|---|---|
| repetition number in this series | 0 | memorised on | scheduled repetition | ||||
| scheduled repetition interval | last repetition or drill |
Parent (intermediate) annotation
Open itfundamentally all elasticities are calculated the same way: they are ratios of percentage changes
Original toplevel document
4. DEMAND ELASTICITIESis to changes in the independent variables that affect them. Here is where the concept of elasticity of demand and supply plays a crucial role in microeconomics. We will examine several elasticities of demand, but the crucial element is that <span>fundamentally all elasticities are calculated the same way: they are ratios of percentage changes. Let us begin with the sensitivity of quantity demanded to changes in the own-price. <span><body><html>
Flashcard 1430475902220
| status | not learned | measured difficulty | 37% [default] | last interval [days] | |||
|---|---|---|---|---|---|---|---|
| repetition number in this series | 0 | memorised on | scheduled repetition | ||||
| scheduled repetition interval | last repetition or drill |
Parent (intermediate) annotation
Open itNote that if the law of demand holds, own-price elasticity of demand will always be negative, because a rise in price will be associated with a fall in quantity demanded, but it can be either elastic or inelastic.
Original toplevel document
4.1. Own-Price Elasticity of Demandthan one, demand is defined to be inelastic. When that magnitude is greater than one, demand is defined to be elastic . And when the elasticity coefficient is equal to negative one, demand is said to be unit elastic , or unitary elastic . <span>Note that if the law of demand holds, own-price elasticity of demand will always be negative, because a rise in price will be associated with a fall in quantity demanded, but it can be either elastic or inelastic. In our hypothetical example, suppose the price of gasoline was very high, say $15 per gallon. In this case, the elasticity coefficient would be −1.154. Therefore, because the magnitude
Flashcard 1430478261516
| status | not learned | measured difficulty | 37% [default] | last interval [days] | |||
|---|---|---|---|---|---|---|---|
| repetition number in this series | 0 | memorised on | scheduled repetition | ||||
| scheduled repetition interval | last repetition or drill |
Parent (intermediate) annotation
Open itstill defined as the percentage change in quantity demanded divided by the percentage change in price. However, because the choice of base for calculating percentage changes has an effect on the calculation, economists have chosen to use the <span>average quantity and the averageprice as the base for calculating the percentage changes.<span><body><html>
Original toplevel document
4.1. Own-Price Elasticity of Demande know that when price is 5, quantity demanded is 9,200, and when price is 6, quantity demanded is 8,800, but we do not know anything more about the demand function. Under these circumstances, economists use something called arc elasticity . <span>Arc elasticity of demand is still defined as the percentage change in quantity demanded divided by the percentage change in price. However, because the choice of base for calculating percentage changes has an effect on the calculation, economists have chosen to use the average quantity and the averageprice as the base for calculating the percentage changes. (Suppose, for example, that you are making a wage of €10 when your boss says, “I’ll increase your wage by 10 percent.” You are then earning €11. But later that day, if your boss then re
Flashcard 1430480620812
| status | not learned | measured difficulty | 37% [default] | last interval [days] | |||
|---|---|---|---|---|---|---|---|
| repetition number in this series | 0 | memorised on | scheduled repetition | ||||
| scheduled repetition interval | last repetition or drill |
Parent (intermediate) annotation
Open itIn our example, then, the arc elasticity of demand would be: E=ΔQQavgΔPPavg=−4009,00015.5=−0.244
Original toplevel document
4.1. Own-Price Elasticity of Demandare then earning €9.90. So, by receiving first a 10 percent raise and then a 10 percent cut in wage, you are worse off. The reason for this is that we typically use the original value as the base, or denominator, for calculating percentages.) <span>In our example, then, the arc elasticity of demand would be: E=ΔQQavgΔPPavg=−4009,00015.5=−0.244 There are two special cases in which linear demand curves have the same elasticity at all points: vertical demand curves and horizontal demand curves. Consider a vertical d
Flashcard 1430484552972
| status | not learned | measured difficulty | 37% [default] | last interval [days] | |||
|---|---|---|---|---|---|---|---|
| repetition number in this series | 0 | memorised on | scheduled repetition | ||||
| scheduled repetition interval | last repetition or drill |
Flashcard 1430486650124
| status | not learned | measured difficulty | 37% [default] | last interval [days] | |||
|---|---|---|---|---|---|---|---|
| repetition number in this series | 0 | memorised on | scheduled repetition | ||||
| scheduled repetition interval | last repetition or drill |
Parent (intermediate) annotation
Open itCertainly, there could be no demand curve that is perfectly vertical at all possible prices, but over some range of prices it is not unreasonable that the same quantity would be purchased at a slightly higher price or a slightly lower price.
Original toplevel document
4.1. Own-Price Elasticity of Demandpoints: vertical demand curves and horizontal demand curves. Consider a vertical demand curve, as in Exhibit 21 Panel A, and a horizontal demand curve, as in Panel B. In the first case, the quantity demanded is the same, regardless of price. <span>Certainly, there could be no demand curve that is perfectly vertical at all possible prices, but over some range of prices it is not unreasonable that the same quantity would be purchased at a slightly higher price or a slightly lower price. Perhaps an individual’s demand for, say, mustard might obey this description. Obviously, in that price range, quantity demanded is not at all sensitive to price and we would say that de
Flashcard 1430489009420
| status | not learned | measured difficulty | 37% [default] | last interval [days] | |||
|---|---|---|---|---|---|---|---|
| repetition number in this series | 0 | memorised on | scheduled repetition | ||||
| scheduled repetition interval | last repetition or drill |
Parent (intermediate) annotation
Open itelasticity is simply a measure of how sensitive one variable is to change in the value of another variable
Original toplevel document
4.3. Income Elasticity of Demand: Normal and Inferior GoodsIn general, elasticity is simply a measure of how sensitive one variable is to change in the value of another variable. Quantity demanded of a good is a function not only of its own price, but also consumer income. If income changes, the quantity demanded can respond, so the analyst needs to understand
Flashcard 1430490582284
| status | not learned | measured difficulty | 37% [default] | last interval [days] | |||
|---|---|---|---|---|---|---|---|
| repetition number in this series | 0 | memorised on | scheduled repetition | ||||
| scheduled repetition interval | last repetition or drill |
Parent (intermediate) annotation
Open itWe define a good with positive income elasticity as a normal good
Original toplevel document
4.3. Income Elasticity of Demand: Normal and Inferior Goodsalways be negative because of the law of demand, income elasticity can be negative, positive, or zero. Positive income elasticity simply means that as income rises, quantity demanded also rises, as is characteristic of most consumption goods. <span>We define a good with positive income elasticity as a normal good . It is perhaps unfortunate that economists often take perfectly good English words and give them different definitions. When an economist speaks of a normal good, he is saying nothing
Flashcard 1430494776588
| status | not learned | measured difficulty | 37% [default] | last interval [days] | |||
|---|---|---|---|---|---|---|---|
| repetition number in this series | 0 | memorised on | scheduled repetition | ||||
| scheduled repetition interval | last repetition or drill |
Parent (intermediate) annotation
Open itOne study found that income elasticity of demand for beer is slightly negative, whereas income elasticity of demand for wine is significantly positive. An economist would therefore say that beer is inferior whereas wine is normal
Original toplevel document
4.3. Income Elasticity of Demand: Normal and Inferior Goodsincome elasticity of demand for that good is observed to be negative. It does not necessarily indicate anything at all about the quality of that good. Typical examples of inferior goods might be rice, potatoes, or less expensive cuts of meat. <span>One study found that income elasticity of demand for beer is slightly negative, whereas income elasticity of demand for wine is significantly positive. An economist would therefore say that beer is inferior whereas wine is normal. Ultimately, whether a good is called inferior or normal is simply a matter of empirical statistical analysis. And a good could be normal for one income group and inferior for another i
Flashcard 1430497922316
| status | not learned | measured difficulty | 37% [default] | last interval [days] | |||
|---|---|---|---|---|---|---|---|
| repetition number in this series | 0 | memorised on | scheduled repetition | ||||
| scheduled repetition interval | last repetition or drill |
Parent (intermediate) annotation
Open itfor some goods and some ranges of income, consumer income might not have an impact on purchase decision at all. Hence for those goods, income elasticity of demand is zero.
Original toplevel document
4.3. Income Elasticity of Demand: Normal and Inferior Goodsup but inferior for a high-income group of consumers. As their respective income levels rose, the moderate group might purchase more BMWs whereas the upper-income group might buy fewer 3-series as they traded up to a 5- or 7-series.) Clearly, <span>for some goods and some ranges of income, consumer income might not have an impact on purchase decision at all. Hence for those goods, income elasticity of demand is zero. Thinking back to our discussion of the demand curve, recall that we invoked the assumption of “holding all other things constant” when we plotted the relationship between p
Flashcard 1430499495180
| status | not learned | measured difficulty | 37% [default] | last interval [days] | |||
|---|---|---|---|---|---|---|---|
| repetition number in this series | 0 | memorised on | scheduled repetition | ||||
| scheduled repetition interval | last repetition or drill |
Parent (intermediate) annotation
Open itany variable on the right-hand side of the demand function can serve as the basis for its own elasticity.
Original toplevel document
4.4. Cross-price Elasticity of Demand: Substitutes and ComplementsIt should be clear by now that any variable on the right-hand side of the demand function can serve as the basis for its own elasticity. Recall that the price of another good might very well have an impact on the demand for a good or service, so we should be able to define an elasticity with respect to the other price, a
Flashcard 1430501330188
| status | not learned | measured difficulty | 37% [default] | last interval [days] | |||
|---|---|---|---|---|---|---|---|
| repetition number in this series | 0 | memorised on | scheduled repetition | ||||
| scheduled repetition interval | last repetition or drill |
Parent (intermediate) annotation
Open ittwo goods whose cross-price elasticity of demand is negative are defined to be complements . Typically, these goods would tend to be consumed together as a pair, such as gasoline and automobiles or houses and furniture
Original toplevel document
4.4. Cross-price Elasticity of Demand: Substitutes and Complementseer. When the price of one of your favorite brands of beer rises, what would you do? You would probably buy less of that brand and more of a cheaper brand, so the cross-price elasticity of demand would be positive. Alternatively, <span>two goods whose cross-price elasticity of demand is negative are defined to be complements . Typically, these goods would tend to be consumed together as a pair, such as gasoline and automobiles or houses and furniture. When automobile prices fall, we might expect the quantity of autos demanded to rise, and thus we might expect to see a rise in the demand for gasoline. Ultimately, though, whether two
Flashcard 1430503951628
| status | not learned | measured difficulty | 37% [default] | last interval [days] | |||
|---|---|---|---|---|---|---|---|
| repetition number in this series | 0 | memorised on | scheduled repetition | ||||
| scheduled repetition interval | last repetition or drill |
Parent (intermediate) annotation
Open itFor complements, however, the impact is in the other direction: When the price of one good rises, the quantity demanded of the other good shifts downward and to the left.
Original toplevel document
4.4. Cross-price Elasticity of Demand: Substitutes and Complementsbbage together as a pair (i.e., that the price of coffee has a relation to the sales of cabbage). For substitute goods, an increase in the price of one good would shift the demand curve for the other good upward and to the right. <span>For complements, however, the impact is in the other direction: When the price of one good rises, the quantity demanded of the other good shifts downward and to the left. <span><body><html>
Flashcard 1430506310924
| status | not learned | measured difficulty | 37% [default] | last interval [days] | |||
|---|---|---|---|---|---|---|---|
| repetition number in this series | 0 | memorised on | scheduled repetition | ||||
| scheduled repetition interval | last repetition or drill |
Parent (intermediate) annotation
Open itIf a good is inferior, a rise in income would result in a downward and leftward shift in the entire demand curve.
Original toplevel document
4.3. Income Elasticity of Demand: Normal and Inferior Goodsall other things constant” when we plotted the relationship between price and quantity demanded. One of the variables we held constant was consumer income. If income were to change, obviously the whole curve would shift one way or the other. <span>For normal goods, a rise in income would shift the entire demand curve upward and to the right, resulting in an increase in demand. If the good were inferior, however, a rise in income would result in a downward and leftward shift in the entire demand curve. <span><body><html>
Flashcard 1430507883788
| status | not learned | measured difficulty | 37% [default] | last interval [days] | |||
|---|---|---|---|---|---|---|---|
| repetition number in this series | 0 | memorised on | scheduled repetition | ||||
| scheduled repetition interval | last repetition or drill |
Parent (intermediate) annotation
Open itOften, economists use simple linear equations to approximate real-world demand and supply functions in relevant ranges.
Original toplevel document
3.1. The Demand Function and the Demand Curvey other goods, not just one, and they can be complements or substitutes.) Equation 1 may be read, “Quantity demanded of good X depends on (is a function of) the price of good X, consumers’ income, the price of good Y, and so on.” <span>Often, economists use simple linear equations to approximate real-world demand and supply functions in relevant ranges. A hypothetical example of a specific demand function could be the following linear equation for a small town’s per-household gasoline consumption per week, where P y might be the average price of an automobile in $1,000s: Equation (2) Qdx=8.4−0.4Px+0.06I−0.01Py The signs of the coefficients on gasoline price (negative) and consumer’s income (positive) are intuitive, reflecting, respectively, an inverse and a positive relationship between those variables and quantity of gasoline consumed. The negative sign on average automobile price may indicate that if automobiles go up in price, fewer will be purchased and driven; hence less gasoline will be consumed. As will be discussed later, such a relationship would indicate that gasoline and automobiles have a negative cross-price elasticity of demand and are thus complements. To continue our example, suppose that the price of gasoline (P x ) is $3 per gallon, per household income (I) is $50,000, and the price of the average automobile (P y ) is
| status | not read | reprioritisations | ||
|---|---|---|---|---|
| last reprioritisation on | suggested re-reading day | |||
| started reading on | finished reading on |
Parent (intermediate) annotation
Open itwhich the quantity willingly offered for sale by sellers at a given price is just equal to the quantity willingly demanded by buyers at that same price. When that condition is met, we say that the market has discovered its equilibrium price. <span>An alternative and equivalent condition of equilibrium occurs at that quantity at which the highest price a buyer is willing to pay is just equal to the lowest price a seller is willing to accept for that same quantity<span><body><html>
Original toplevel document
3.6. Market EquilibriumAn important concept in the market model is market equilibrium , defined as the condition in which the quantity willingly offered for sale by sellers at a given price is just equal to the quantity willingly demanded by buyers at that same price. When that condition is met, we say that the market has discovered its equilibrium price. An alternative and equivalent condition of equilibrium occurs at that quantity at which the highest price a buyer is willing to pay is just equal to the lowest price a seller is willing to accept for that same quantity. As we have discovered in the earlier sections, the demand curve shows (for given values of income, other prices, etc.) an infinite number of combinations of prices and qua
Flashcard 1430511815948
| status | not learned | measured difficulty | 37% [default] | last interval [days] | |||
|---|---|---|---|---|---|---|---|
| repetition number in this series | 0 | memorised on | scheduled repetition | ||||
| scheduled repetition interval | last repetition or drill |
Parent (intermediate) annotation
Open itbehavioral equations because they model the behavior of, respectively, buyers and sellers.
Original toplevel document
3.6. Market Equilibriumthe supply function and solving for price. Recall that in our hypothetical example of a local gasoline market, the demand function was given by Qdx=f(Px,I,Py) , and the supply function was given by Qsx=f(Px,W) . Those expressions are called <span>behavioral equations because they model the behavior of, respectively, buyers and sellers. Variables other than own price and quantity are determined outside of the demand and supply model of this particular market. Because of that, they are called exogenous variables . Pric
Flashcard 1430514961676
| status | not learned | measured difficulty | 37% [default] | last interval [days] | |||
|---|---|---|---|---|---|---|---|
| repetition number in this series | 0 | memorised on | scheduled repetition | ||||
| scheduled repetition interval | last repetition or drill |
Parent (intermediate) annotation
Open itNote that our system of equations requires explicit values for the exogenous variables to find a unique equilibrium combination of price and quantity. Conceptually, the values of the exogenous variables are being determined in other markets, such as the markets
Original toplevel document
3.6. Market EquilibriumQ x = 1 + 0.0002Q x and solved for equilibrium, Q x = 10,000. That is to say, for the given values of I and W, the unique combination of price and quantity of gasoline that results in equilibrium is (3, 10,000). <span>Note that our system of equations requires explicit values for the exogenous variables to find a unique equilibrium combination of price and quantity. Conceptually, the values of the exogenous variables are being determined in other markets, such as the markets for labor, automobiles, and so on, whereas the price and quantity of gasoline are being determined in the gasoline market. When we concentrate on one market, taking values of exogenous variables as given, we are engaging in what is called partial equilibrium analysis . In many cases, we can gain sufficient
Flashcard 1430517583116
| status | not learned | measured difficulty | 37% [default] | last interval [days] | |||
|---|---|---|---|---|---|---|---|
| repetition number in this series | 0 | memorised on | scheduled repetition | ||||
| scheduled repetition interval | last repetition or drill |
Parent (intermediate) annotation
Open itrkets that are tangentially involved with this one. At other times, however, we need explicitly to take account of all the feedback mechanisms that are going on in all markets simultaneously. When we do that, we are engaging in what is called <span>general equilibrium analysis .<span><body><html>
Original toplevel document
3.6. Market Equilibriumso on, whereas the price and quantity of gasoline are being determined in the gasoline market. When we concentrate on one market, taking values of exogenous variables as given, we are engaging in what is called partial equilibrium analysis . <span>In many cases, we can gain sufficient insight into a market of interest without addressing feedback effects to and from all the other markets that are tangentially involved with this one. At other times, however, we need explicitly to take account of all the feedback mechanisms that are going on in all markets simultaneously. When we do that, we are engaging in what is called general equilibrium analysis .For example, in our hypothetical model of the local gasoline market, we recognize that the price of automobiles, a complementary product, has an impact on the demand for gasoline. If the
Flashcard 1430519418124
| status | not learned | measured difficulty | 37% [default] | last interval [days] | |||
|---|---|---|---|---|---|---|---|
| repetition number in this series | 0 | memorised on | scheduled repetition | ||||
| scheduled repetition interval | last repetition or drill |
Parent (intermediate) annotation
Open itwhich there is some actual common value that will ultimately be revealed after the auction is settled. Prior to the auction’s settlement, however, bidders must estimate that true value. An example of a common value auction would be bidding on <span>a jar containing many coins. Each bidder could estimate the value; but until someone buys the jar and actually counts the coins, no one knows with certainty the true value.<span><body><html>
Original toplevel document
3.8. Auctions as a Way to Find Equilibrium Price> Sometimes markets really do use auctions to arrive at equilibrium price. Auctions can be categorized into two types depending on whether the value of the item being sold is the same for each bidder or is unique to each bidder. <span>The first case is called a common value auction in which there is some actual common value that will ultimately be revealed after the auction is settled. Prior to the auction’s settlement, however, bidders must estimate that true value. An example of a common value auction would be bidding on a jar containing many coins. Each bidder could estimate the value; but until someone buys the jar and actually counts the coins, no one knows with certainty the true value. In the second case, called a private value auction , each buyer places a subjective value on the item, and in general their values differ. An example might be an auction for a unique p
Flashcard 1430521777420
| status | not learned | measured difficulty | 37% [default] | last interval [days] | |||
|---|---|---|---|---|---|---|---|
| repetition number in this series | 0 | memorised on | scheduled repetition | ||||
| scheduled repetition interval | last repetition or drill |
Parent (intermediate) annotation
Open itThe first case is called a common value auction in which there is some actual common value that will ultimately be revealed after the auction is settled. Prior to the auction’s settlement, however, bidders must estimate that true val
Original toplevel document
3.8. Auctions as a Way to Find Equilibrium Price> Sometimes markets really do use auctions to arrive at equilibrium price. Auctions can be categorized into two types depending on whether the value of the item being sold is the same for each bidder or is unique to each bidder. <span>The first case is called a common value auction in which there is some actual common value that will ultimately be revealed after the auction is settled. Prior to the auction’s settlement, however, bidders must estimate that true value. An example of a common value auction would be bidding on a jar containing many coins. Each bidder could estimate the value; but until someone buys the jar and actually counts the coins, no one knows with certainty the true value. In the second case, called a private value auction , each buyer places a subjective value on the item, and in general their values differ. An example might be an auction for a unique p
| status | not read | reprioritisations | ||
|---|---|---|---|---|
| last reprioritisation on | suggested re-reading day | |||
| started reading on | finished reading on |
Common value auction - Wikipedia
ions. [1] A classic example of a pure common values auction is when a jar full of quarters is auctioned off. The jar will be worth the same amount to anyone. However, each bidder has a different guess about how many quarters are in the jar. <span>Other, real-life examples include Treasury bill auctions, initial public offerings, spectrum auctions, very prized paintings, art pieces, antiques etc. One important phenomenon occurring in common value auctions is the winner's curse. Bidders have only estimates of the value of the good. If, on average, bidders are estimating correct
Flashcard 1430528593164
| status | not learned | measured difficulty | 37% [default] | last interval [days] | |||
|---|---|---|---|---|---|---|---|
| repetition number in this series | 0 | memorised on | scheduled repetition | ||||
| scheduled repetition interval | last repetition or drill |
Parent (intermediate) annotation
Open itAnother Dutch auction variation, also involving a single price and called a single price auction , is used in selling US Treasury securities.6The single price Treasury bill auction operates as follows: The T
Original toplevel document
3.8. Auctions as a Way to Find Equilibrium Pricecontinue to qualify bids at higher prices until 3 million shares had been qualified. In our example, that price might be €27. Shareholders who bid between €26 and €27, inclusive, would then be paid €27 per share for their shares. <span>Another Dutch auction variation, also involving a single price and called a single price auction , is used in selling US Treasury securities.6The single price Treasury bill auction operates as follows: The Treasury announces that it will auction 26-week T-bills with an offering amount of, say, $90 billion with both competitive and non-competitive bidding. Non-competitive bidders state the total face value they are willing to purchase at the ultimate price (yield) that clears the market (i.e., sells all of the securities offered), whatever that turns out to be. Competitive bidders each submit a total face value amount and the price at which they are willing to purchase those bills. The Treasury then ranks those bids in ascending order of yield (i.e., descending order of price) and finds the yield at which the total $90 billion offering amount would be sold. If the offering amount is just equal to the total face value bidders are willing to purchase at that yield, then all the T-bills are sold for that single yield. If there is excess demand at that yield, then bidders would each receive a proportionately smaller total than they offered. As an example, suppose the following table shows the prices and the offers from competitive bidders for a variety of prices, as well as the total offers from non-competitiv
Flashcard 1430530952460
| status | not learned | measured difficulty | 37% [default] | last interval [days] | |||
|---|---|---|---|---|---|---|---|
| repetition number in this series | 0 | memorised on | scheduled repetition | ||||
| scheduled repetition interval | last repetition or drill |
Parent (intermediate) annotation
Open itis there some reasonable measure we can apply to the outcome of a competitive market that enables us to say whether that outcome is socially desirable? Economists have developed two related concepts called consumer surplus and producer surplus to address that question. We will begin with consumer surplus, which is a measure of how much net benefit buyers enjoy from the ability to participate in a particul
Original toplevel document
3.9. Consumer Surplus—Value minus Expenditurecrucial to have a sense of why we might care whether the market tends toward equilibrium. This question moves us into the normative, or evaluative, consideration of whether market equilibrium is desirable in any social sense. In other words, <span>is there some reasonable measure we can apply to the outcome of a competitive market that enables us to say whether that outcome is socially desirable? Economists have developed two related concepts called consumer surplus and producer surplus to address that question. We will begin with consumer surplus, which is a measure of how much net benefit buyers enjoy from the ability to participate in a particular market. To get an intuitive feel for this concept, consider the last thing you purchased. Maybe it was a cup of coffee, a new pair of shoes, or a new car. Whatever it was, think of
Flashcard 1430533311756
| status | not learned | measured difficulty | 37% [default] | last interval [days] | |||
|---|---|---|---|---|---|---|---|
| repetition number in this series | 0 | memorised on | scheduled repetition | ||||
| scheduled repetition interval | last repetition or drill |
Parent (intermediate) annotation
Open itGraphically, this measure translates into the area under the consumer’s demand curve, up to and including the last unit consumed
Original toplevel document
3.9. Consumer Surplus—Value minus Expenditureonal unit. This interpretation of the demand curve allows us to measure the total value of consuming any given quantity of a good: It is the sum of all the marginal values of each unit consumed, up to and including the last unit. <span>Graphically, this measure translates into the area under the consumer’s demand curve, up to and including the last unit consumed, as shown in Exhibit 12, in which the consumer is choosing to buy Q 1 units of the good at a price of P 1 . The marginal value of the Qth1 unit is clearly P 1 , because that is the h
Flashcard 1430535933196
| status | not learned | measured difficulty | 37% [default] | last interval [days] | |||
|---|---|---|---|---|---|---|---|
| repetition number in this series | 0 | memorised on | scheduled repetition | ||||
| scheduled repetition interval | last repetition or drill |
Parent (intermediate) annotation
Open itThe demand and supply model is useful in explaining how price and quantity traded are determined and how external influences affect the values of those variables
Original toplevel document
3. BASIC PRINCIPLES AND CONCEPTSse a given amount of a good or service at a given price. Supply is the willingness of sellers to offer a given quantity of a good or service for a given price. Later, study on the theory of the firm will yield the supply curve. <span>The demand and supply model is useful in explaining how price and quantity traded are determined and how external influences affect the values of those variables. Buyers’ behavior is captured in the demand function and its graphical equivalent, the demand curve. This curve shows both the highest price buyers are willing to pay for each quantity, and the highest quantity buyers are willing and able to purchase at each price. Sellers’ behavior is captured in the supply function and its graphical equivalent, the supply curve. This curve shows simultaneously the lowest price sellers are willing to accept for each quantity and the highest quantity sellers are willing to offer at each price. If, at a given quantity, the highest price that buyers are willing to pay is equal to the lowest price that sellers are willing to accept, we say the market has reached it
Flashcard 1430537506060
| status | not learned | measured difficulty | 37% [default] | last interval [days] | |||
|---|---|---|---|---|---|---|---|
| repetition number in this series | 0 | memorised on | scheduled repetition | ||||
| scheduled repetition interval | last repetition or drill |
Parent (intermediate) annotation
Open itconsumers and producers both receive “a bargain” when they are allowed to engage in a mutually beneficial, voluntary exchange with one another
Original toplevel document
3.11. Total Surplus—Total Value minus Total Variable CostIn the previous sections, we have seen that consumers and producers both receive “a bargain” when they are allowed to engage in a mutually beneficial, voluntary exchange with one another. For every unit up to the equilibrium unit traded, buyers would have been willing to pay more than they actually had to pay. Additionally, for every one of those units, sellers would ha
Flashcard 1430541438220
| status | not learned | measured difficulty | 37% [default] | last interval [days] | |||
|---|---|---|---|---|---|---|---|
| repetition number in this series | 0 | memorised on | scheduled repetition | ||||
| scheduled repetition interval | last repetition or drill |
Parent (intermediate) annotation
Open itwhen the magnitude(ignoring algebraic sign) of the own-price elasticity coefficient has a value less than one, demand is defined to be inelastic
Original toplevel document
4.1. Own-Price Elasticity of Demandded by only 0.12 percent. Actually, that is not too different from empirical estimates of the actual demand elasticity for gasoline in the United States. When demand is not very sensitive to price, we say demand is inelastic . To be precise, <span>when the magnitude(ignoring algebraic sign) of the own-price elasticity coefficient has a value less than one, demand is defined to be inelastic. When that magnitude is greater than one, demand is defined to be elastic . And when the elasticity coefficient is equal to negative one, demand is said to be unit elastic , or unita
Flashcard 1430546156812
| status | not learned | measured difficulty | 37% [default] | last interval [days] | |||
|---|---|---|---|---|---|---|---|
| repetition number in this series | 0 | memorised on | scheduled repetition | ||||
| scheduled repetition interval | last repetition or drill |
Parent (intermediate) annotation
Open itions sell items that (generally) have a unique subjective value for each bidder. Ascending price auctions use an auctioneer to call out ever increasing prices until the last, highest bidder ultimately pays his/her bid price and buys the item. <span>Descending price, or Dutch, auctions begin at a very high price and then reduce that price until one bidder is willing to buy at that price. Second price sealed bid auctions are sometimes used to induce
Original toplevel document
SUMMARYven price, the quantity demanded exceeds the quantity supplied, there is excess demand and price will rise. If, at a given price, the quantity supplied exceeds the quantity demanded, there is excess supply and price will fall. <span>Sometimes auctions are used to seek equilibrium prices. Common value auctions sell items that have the same value to all bidders, but bidders can only estimate that value before the auction is completed. Overly optimistic bidders overestimate the true value and end up paying a price greater than that value. This result is known as the winner’s curse. Private value auctions sell items that (generally) have a unique subjective value for each bidder. Ascending price auctions use an auctioneer to call out ever increasing prices until the last, highest bidder ultimately pays his/her bid price and buys the item. Descending price, or Dutch, auctions begin at a very high price and then reduce that price until one bidder is willing to buy at that price. Second price sealed bid auctions are sometimes used to induce bidders to reveal their true reservation prices in private value auctions. Treasury notes and some other financial instruments are sold using a form of Dutch auction (called a single price auction) in which competitive and non-competitive bids are arrayed in descending price (increasing yield) order. The winning bidders all pay the same price, but marginal bidders might not be able to fill their entire order at the market clearing price. Markets that work freely can optimize society’s welfare, as measured by consumer surplus and producer surplus. Consumer surplus is the difference between the total value
| status | not read | reprioritisations | ||
|---|---|---|---|---|
| last reprioritisation on | suggested re-reading day | |||
| started reading on | finished reading on |
| status | not read | reprioritisations | ||
|---|---|---|---|---|
| last reprioritisation on | suggested re-reading day | |||
| started reading on | finished reading on |
| status | not read | reprioritisations | ||
|---|---|---|---|---|
| last reprioritisation on | suggested re-reading day | |||
| started reading on | finished reading on |
| status | not read | reprioritisations | ||
|---|---|---|---|---|
| last reprioritisation on | suggested re-reading day | |||
| started reading on | finished reading on |
| status | not read | reprioritisations | ||
|---|---|---|---|---|
| last reprioritisation on | suggested re-reading day | |||
| started reading on | finished reading on |
Article 1430657568012
LEARNING OUTCOMES
#cfa #cfa-level-1 #economics #microeconomics #reading-14-demand-and-supply-analysis-consumer-demand #study-session-4-microeconomics-analysis
The candidate should be able to: describe consumer choice theory and utility theory; describe the use of indifference curves, opportunity sets, and budget constraints in decision making; calculate and interpret a budget constraint; determine a consumer’s equilibrium bundle of goods based on utility analysis; compare substitution and income effects; distinguish between normal goods and inferior goods and explain Giffen goods and Veblen goods in this context.
Flashcard 1430658878732
| status | not learned | measured difficulty | 37% [default] | last interval [days] | |||
|---|---|---|---|---|---|---|---|
| repetition number in this series | 0 | memorised on | scheduled repetition | ||||
| scheduled repetition interval | last repetition or drill |
LEARNING OUTCOMES
The candidate should be able to: describe consumer choice theory and utility theory; describe the use of indifference curves, opportunity sets, and budget constraints in decision making; calculate and interpret a budget constraint;
The candidate should be able to: describe consumer choice theory and utility theory; describe the use of indifference curves, opportunity sets, and budget constraints in decision making; calculate and interpret a budget constraint;
Article 1430662024460
1. INTRODUCTION
#cfa #cfa-level-1 #economics #microeconomics #reading-14-demand-and-supply-analysis-consumer-demand #study-session-4-microeconomics-analysis
By now it should be clear that economists are model builders. In the previous reading, we examined one of their most fundamental models, the model of demand and supply. And as we have seen, models begin with simplifying assumptions and then find the implications that can then be compared to real-world observations as a test of the model’s usefulness. In the model of demand and supply, we assumed the existence of a demand curve and a supply curve, as well as their respective negative and positive slopes. That simple model yielded some very powerful implications about how markets work, but we can delve even more deeply to explore the underpinnings of demand and supply. In this reading, we examine the theory of the consumer as a way of understanding where consumer demand curves originate. In a subsequent reading, the origins of the supply curve are sought in presenting the theory of the firm. This reading is organized as follows: Section 2 describes consumer choice theory in more detail. Section 3 introd
Flashcard 1430663335180
| status | not learned | measured difficulty | 37% [default] | last interval [days] | |||
|---|---|---|---|---|---|---|---|
| repetition number in this series | 0 | memorised on | scheduled repetition | ||||
| scheduled repetition interval | last repetition or drill |
1. INTRODUCTION
By now it should be clear that economists are model builders. In the previous reading, we examined one of their most fundamental models, the model of demand and supply. And as we have seen, models begin with simplifying assumptions and then find
By now it should be clear that economists are model builders. In the previous reading, we examined one of their most fundamental models, the model of demand and supply. And as we have seen, models begin with simplifying assumptions and then find
Flashcard 1430666480908
| status | not learned | measured difficulty | 37% [default] | last interval [days] | |||
|---|---|---|---|---|---|---|---|
| repetition number in this series | 0 | memorised on | scheduled repetition | ||||
| scheduled repetition interval | last repetition or drill |
1. INTRODUCTION
ad><head> By now it should be clear that economists are model builders. In the previous reading, we examined one of their most fundamental models, the model of demand and supply. And as we have seen, models begin with simplifying assumptions and then find the implications that can then be compared to real-world observations as a test of the model’s usefulness. In the model of demand and supply, we assumed the existence of a
ad><head> By now it should be clear that economists are model builders. In the previous reading, we examined one of their most fundamental models, the model of demand and supply. And as we have seen, models begin with simplifying assumptions and then find the implications that can then be compared to real-world observations as a test of the model’s usefulness. In the model of demand and supply, we assumed the existence of a
| status | not read | reprioritisations | ||
|---|---|---|---|---|
| last reprioritisation on | suggested re-reading day | |||
| started reading on | finished reading on |
1. INTRODUCTION
r most fundamental models, the model of demand and supply. And as we have seen, models begin with simplifying assumptions and then find the implications that can then be compared to real-world observations as a test of the model’s usefulness. <span>In the model of demand and supply, we assumed the existence of a demand curve and a supply curve, as well as their respective negative and positive slopes. That simple model yielded some very powerful implications about how markets work, but we can delve even more deeply to explore the underpinnings of demand and supply. In this reading, we examine the theory of the consumer as a way of understanding where consumer demand curves originate. In a subsequent reading, the origins of the supply curve are sought in presenting the theory of the firm. This reading is organized as follows: Section 2 describes consumer choice theory in more detail. Section 3 introduces utility theory, a building block of consumer choice th
Flashcard 1430670413068
| status | not learned | measured difficulty | 37% [default] | last interval [days] | |||
|---|---|---|---|---|---|---|---|
| repetition number in this series | 0 | memorised on | scheduled repetition | ||||
| scheduled repetition interval | last repetition or drill |
Parent (intermediate) annotation
Open itir respective negative and positive slopes. That simple model yielded some very powerful implications about how markets work, but we can delve even more deeply to explore the underpinnings of demand and supply. In this reading, we examine the <span>theory of the consumer as a way of understanding where consumer demand curves originate. In a subsequent reading, the origins of the supply curve are sought in presenting the theory of the firm.<span>
Original toplevel document
1. INTRODUCTIONr most fundamental models, the model of demand and supply. And as we have seen, models begin with simplifying assumptions and then find the implications that can then be compared to real-world observations as a test of the model’s usefulness. <span>In the model of demand and supply, we assumed the existence of a demand curve and a supply curve, as well as their respective negative and positive slopes. That simple model yielded some very powerful implications about how markets work, but we can delve even more deeply to explore the underpinnings of demand and supply. In this reading, we examine the theory of the consumer as a way of understanding where consumer demand curves originate. In a subsequent reading, the origins of the supply curve are sought in presenting the theory of the firm. This reading is organized as follows: Section 2 describes consumer choice theory in more detail. Section 3 introduces utility theory, a building block of consumer choice th
| status | not read | reprioritisations | ||
|---|---|---|---|---|
| last reprioritisation on | suggested re-reading day | |||
| started reading on | finished reading on |
1. INTRODUCTION
y. In this reading, we examine the theory of the consumer as a way of understanding where consumer demand curves originate. In a subsequent reading, the origins of the supply curve are sought in presenting the theory of the firm. <span>This reading is organized as follows: Section 2 describes consumer choice theory in more detail. Section 3 introduces utility theory, a building block of consumer choice theory that provides a quantitative model for a consumer’s preferences and tastes. Section 4 surveys budget constraints and opportunity sets. Section 5 covers the determination of the consumer’s bundle of goods and how that may change in response to changes in income and prices. Section 6 examines substitution and income effects for different types of goods. A summary and practice problems conclude the reading. <span><body><html>
Flashcard 1430678277388
| status | not learned | measured difficulty | 37% [default] | last interval [days] | |||
|---|---|---|---|---|---|---|---|
| repetition number in this series | 0 | memorised on | scheduled repetition | ||||
| scheduled repetition interval | last repetition or drill |
Parent (intermediate) annotation
Open itThis reading is organized as follows: Section 2 describes consumer choice theory in more detail. Section 3 introduces utility theory, a building block of consumer choice theory that provides a quantitative model for a consumer’s preferences and tastes.
Original toplevel document
1. INTRODUCTIONy. In this reading, we examine the theory of the consumer as a way of understanding where consumer demand curves originate. In a subsequent reading, the origins of the supply curve are sought in presenting the theory of the firm. <span>This reading is organized as follows: Section 2 describes consumer choice theory in more detail. Section 3 introduces utility theory, a building block of consumer choice theory that provides a quantitative model for a consumer’s preferences and tastes. Section 4 surveys budget constraints and opportunity sets. Section 5 covers the determination of the consumer’s bundle of goods and how that may change in response to changes in income and prices. Section 6 examines substitution and income effects for different types of goods. A summary and practice problems conclude the reading. <span><body><html>
Article 1430679850252
2. CONSUMER THEORY: FROM PREFERENCES TO DEMAND FUNCTIONS
#cfa #cfa-level-1 #economics #microeconomics #reading-14-demand-and-supply-analysis-consumer-demand #section-2-consumer-theory-from-preferences-to-demand-function #study-session-4-microeconomics-analysis
The introduction to demand and supply analysis in the previous reading basically assumed that the demand function exists, and focused on understanding its various characteristics and manifestations. In this reading, we address the foundations of demand and supply analysis and seek to understand the sources of consumer demand through the theory of the consumer, also known as consumer choice theory. Consumer choice theory can be defined as the branch of microeconomics that relates consumer demand curves to consumer preferences. Consumer choice theory begins with a fundamental model of how consumer preferences and tastes might be represented. It explores consumers’ willingness to trade off between two goods (or two baskets of goods), both of which the consumer finds beneficial. Consumer choice theory then recognizes that to consume a set of goods and services, consumers must purchase them at given market prices and with a limited income. In effect, consumer choice theory first models what the consumer would li
| status | not read | reprioritisations | ||
|---|---|---|---|---|
| last reprioritisation on | suggested re-reading day | |||
| started reading on | finished reading on |
Flashcard 1430682995980
| status | not learned | measured difficulty | 37% [default] | last interval [days] | |||
|---|---|---|---|---|---|---|---|
| repetition number in this series | 0 | memorised on | scheduled repetition | ||||
| scheduled repetition interval | last repetition or drill |
Parent (intermediate) annotation
Open itSo exactly what does the ~ E in Gauss’s law represent? It represents the total electric field at each point on the surface under consideration.
Original toplevel document (pdf)
cannot see any pdfsFlashcard 1430684568844
| status | not learned | measured difficulty | 37% [default] | last interval [days] | |||
|---|---|---|---|---|---|---|---|
| repetition number in this series | 0 | memorised on | scheduled repetition | ||||
| scheduled repetition interval | last repetition or drill |
Parent (intermediate) annotation
Open itSo exactly what does the ~ E in Gauss’s law represent? It represents the total electric field at each point on the surface under consideration.
Original toplevel document (pdf)
cannot see any pdfsFlashcard 1430687452428
| status | not learned | measured difficulty | 37% [default] | last interval [days] | |||
|---|---|---|---|---|---|---|---|
| repetition number in this series | 0 | memorised on | scheduled repetition | ||||
| scheduled repetition interval | last repetition or drill |
Parent (intermediate) annotation
Open itFAAH reduces the production of known endogenous cannabinoids, specifically, anandamide (AEA) and 2-arachidonoylglycerol (2-AG)
Original toplevel document
Molecular mechanisms involved in the side effects of fatty acid amide hydrolase inhibitors: a structural phenomics approach to proteome-wide cellular off-target deconvolution and disease association : npj Systems Biology and Applications. 1 It is distributed in several of the major organs of the human body, but is also regionally distributed in the brain where it is believed to correlate with cannibinoid receptors. 2 In particular, it is believed that the overexpression of <span>FAAH reduces the production of known endogenous cannabinoids, specifically, anandamide (AEA) and 2-arachidonoylglycerol (2-AG). 3 This makes FAAH an attractive drug target, as inhibition of FAAH would, through the upregulation of AEA and 2-AG, elicit the effects of cannabinoid activation. Thus, FAAH inhibitors
Flashcard 1430689025292
| status | not learned | measured difficulty | 37% [default] | last interval [days] | |||
|---|---|---|---|---|---|---|---|
| repetition number in this series | 0 | memorised on | scheduled repetition | ||||
| scheduled repetition interval | last repetition or drill |
Parent (intermediate) annotation
Open itFAAH reduces the production of known endogenous cannabinoids, specifically, anandamide (AEA) and 2-arachidonoylglycerol (2-AG)
Original toplevel document
Molecular mechanisms involved in the side effects of fatty acid amide hydrolase inhibitors: a structural phenomics approach to proteome-wide cellular off-target deconvolution and disease association : npj Systems Biology and Applications. 1 It is distributed in several of the major organs of the human body, but is also regionally distributed in the brain where it is believed to correlate with cannibinoid receptors. 2 In particular, it is believed that the overexpression of <span>FAAH reduces the production of known endogenous cannabinoids, specifically, anandamide (AEA) and 2-arachidonoylglycerol (2-AG). 3 This makes FAAH an attractive drug target, as inhibition of FAAH would, through the upregulation of AEA and 2-AG, elicit the effects of cannabinoid activation. Thus, FAAH inhibitors
Flashcard 1430691122444
| status | not learned | measured difficulty | 37% [default] | last interval [days] | |||
|---|---|---|---|---|---|---|---|
| repetition number in this series | 0 | memorised on | scheduled repetition | ||||
| scheduled repetition interval | last repetition or drill |
Parent (intermediate) annotation
Open itough notation differs among textbooks, the integral form is generally written like this: I S ~ E ^ nda ¼ q enc e 0 Gauss’s law for electric fields (integral form). The left side of this equation is no more than a mathematical description of <span>the electric flux – the number of electric field lines – passing through a closed surface S, whereas the right side is the total amount of charge contained within that surface divided by a constant called the permittivity of free space<span><body><html>
Original toplevel document (pdf)
cannot see any pdfsFlashcard 1430692695308
| status | not learned | measured difficulty | 37% [default] | last interval [days] | |||
|---|---|---|---|---|---|---|---|
| repetition number in this series | 0 | memorised on | scheduled repetition | ||||
| scheduled repetition interval | last repetition or drill |
Parent (intermediate) annotation
Open its law for electric fields (integral form). The left side of this equation is no more than a mathematical description of the electric flux – the number of electric field lines – passing through a closed surface S, whereas the right side is the <span>total amount of charge contained within that surface divided by a constant called the permittivity of free space<span><body><html>
Original toplevel document (pdf)
cannot see any pdfsFlashcard 1430694530316
| status | not learned | measured difficulty | 37% [default] | last interval [days] | |||
|---|---|---|---|---|---|---|---|
| repetition number in this series | 0 | memorised on | scheduled repetition | ||||
| scheduled repetition interval | last repetition or drill |
Parent (intermediate) annotation
Open itHow is Gauss’s law useful? There are two basic types of problems that you can solve using this equation: (1) Give n information about a distribution of electric charge, you can find the electric flux through a surface enclosing that charge. (2) Give n information about the electric flux through a closed surface, you can find the total electric charge enclosed by that surface
Original toplevel document (pdf)
cannot see any pdfsFlashcard 1430696889612
| status | not learned | measured difficulty | 37% [default] | last interval [days] | |||
|---|---|---|---|---|---|---|---|
| repetition number in this series | 0 | memorised on | scheduled repetition | ||||
| scheduled repetition interval | last repetition or drill |
Parent (intermediate) annotation
Open itou can solve using this equation: (1) Give n information about a distribution of electric charge, you can find the electric flux through a surface enclosing that charge. (2) Give n information about the electric flux through a closed surface, <span>you can find the total electric charge enclosed by that surface<span><body><html>
Original toplevel document (pdf)
cannot see any pdfs| status | not read | reprioritisations | ||
|---|---|---|---|---|
| last reprioritisation on | suggested re-reading day | |||
| started reading on | finished reading on |
| status | not read | reprioritisations | ||
|---|---|---|---|---|
| last reprioritisation on | suggested re-reading day | |||
| started reading on | finished reading on |
Parent (intermediate) annotation
Open ittwo important characteris tics of the electric field: (1) ~ E is a vector quantity with magnitude directly proportional to force and with direction given by the direction of the force on a positive test charge. (2) ~ E ha s units of newtons per coulomb (N/C), which are the same as volts per meter (V/m), since volts ¼ newtons · meters/coulombs
Original toplevel document (pdf)
cannot see any pdfs| status | not read | reprioritisations | ||
|---|---|---|---|---|
| last reprioritisation on | suggested re-reading day | |||
| started reading on | finished reading on |
Parent (intermediate) annotation
Open itad><head>two important characteris tics of the electric field: (1) ~ E is a vector quantity with magnitude directly proportional to force and with direction given by the direction of the force on a positive test charge. (2) ~ E ha s units of newtons per coulomb (N/C), which are the same as volts per meter (V/m), since volts ¼ newtons · meters/coulombs<html>
Original toplevel document (pdf)
cannot see any pdfs| status | not read | reprioritisations | ||
|---|---|---|---|---|
| last reprioritisation on | suggested re-reading day | |||
| started reading on | finished reading on |
2. CONSUMER THEORY: FROM PREFERENCES TO DEMAND FUNCTIONS
The introduction to demand and supply analysis in the previous reading basically assumed that the demand function exists, and focused on understanding its various characteristics and manifestations. In this reading, we address the foundations of demand and supply analysis and seek to understand the sources of consumer demand through the theory of the consumer, also known as consume
Flashcard 1430707113228
| status | not learned | measured difficulty | 37% [default] | last interval [days] | |||
|---|---|---|---|---|---|---|---|
| repetition number in this series | 0 | memorised on | scheduled repetition | ||||
| scheduled repetition interval | last repetition or drill |
2. CONSUMER THEORY: FROM PREFERENCES TO DEMAND FUNCTIONS
ous characteristics and manifestations. In this reading, we address the foundations of demand and supply analysis and seek to understand the sources of consumer demand through the theory of the consumer, also known as consumer choice theory. <span>Consumer choice theory can be defined as the branch of microeconomics that relates consumer demand curves to consumer preferences. Consumer choice theory begins with a fundamental model of how consumer prefe
ous characteristics and manifestations. In this reading, we address the foundations of demand and supply analysis and seek to understand the sources of consumer demand through the theory of the consumer, also known as consumer choice theory. <span>Consumer choice theory can be defined as the branch of microeconomics that relates consumer demand curves to consumer preferences. Consumer choice theory begins with a fundamental model of how consumer prefe
Flashcard 1430709472524
| status | not learned | measured difficulty | 37% [default] | last interval [days] | |||
|---|---|---|---|---|---|---|---|
| repetition number in this series | 0 | memorised on | scheduled repetition | ||||
| scheduled repetition interval | last repetition or drill |
2. CONSUMER THEORY: FROM PREFERENCES TO DEMAND FUNCTIONS
consumer, also known as consumer choice theory. Consumer choice theory can be defined as the branch of microeconomics that relates consumer demand curves to consumer preferences. Consumer choice theory begins with a fundamental model of how <span>consumer preferences and tastes might be represented. It explores consumers’ willingness to trade off between two goods (or two baskets of goods), both of which the consumer finds beneficial. Consumer choice theory th
consumer, also known as consumer choice theory. Consumer choice theory can be defined as the branch of microeconomics that relates consumer demand curves to consumer preferences. Consumer choice theory begins with a fundamental model of how <span>consumer preferences and tastes might be represented. It explores consumers’ willingness to trade off between two goods (or two baskets of goods), both of which the consumer finds beneficial. Consumer choice theory th
| status | not read | reprioritisations | ||
|---|---|---|---|---|
| last reprioritisation on | suggested re-reading day | |||
| started reading on | finished reading on |
2. CONSUMER THEORY: FROM PREFERENCES TO DEMAND FUNCTIONS
mer choice theory can be defined as the branch of microeconomics that relates consumer demand curves to consumer preferences. Consumer choice theory begins with a fundamental model of how consumer preferences and tastes might be represented. <span>It explores consumers’ willingness to trade off between two goods (or two baskets of goods), both of which the consumer finds beneficial. Consumer choice theory then recognizes that to consume a set of goods and services, consumers must purchase them at given market prices and with a limited income. In effect, consumer ch
Flashcard 1430714191116
| status | not learned | measured difficulty | 37% [default] | last interval [days] | |||
|---|---|---|---|---|---|---|---|
| repetition number in this series | 0 | memorised on | scheduled repetition | ||||
| scheduled repetition interval | last repetition or drill |
| status | not read | reprioritisations | ||
|---|---|---|---|---|
| last reprioritisation on | suggested re-reading day | |||
| started reading on | finished reading on |
2. CONSUMER THEORY: FROM PREFERENCES TO DEMAND FUNCTIONS
oice theory begins with a fundamental model of how consumer preferences and tastes might be represented. It explores consumers’ willingness to trade off between two goods (or two baskets of goods), both of which the consumer finds beneficial. <span>Consumer choice theory then recognizes that to consume a set of goods and services, consumers must purchase them at given market prices and with a limited income. In effect, consumer choice theory first models what the consumer would like to consume, and then it examines what the consumer can consume with limited income. Finally, by superimposing
Flashcard 1430717336844
| status | not learned | measured difficulty | 37% [default] | last interval [days] | |||
|---|---|---|---|---|---|---|---|
| repetition number in this series | 0 | memorised on | scheduled repetition | ||||
| scheduled repetition interval | last repetition or drill |
Parent (intermediate) annotation
Open itwe discover that FAAH inhibitors may bind to the dimerization interface of NMDA receptor (NMDAR) and several other BAs, and thus disrupt their cellular functions
Original toplevel document
Molecular mechanisms involved in the side effects of fatty acid amide hydrolase inhibitors: a structural phenomics approach to proteome-wide cellular off-target deconvolution and disease association : npj Systems Biology and Applicationsinding profile in the cellular context and on a structural proteome scale, and investigate the roles of these off-targets in impacting human physiology and pathology using text mining-based phenomics analysis. Using this integrative approach, <span>we discover that FAAH inhibitors may bind to the dimerization interface of NMDA receptor (NMDAR) and several other BAs, and thus disrupt their cellular functions. Specifically, the malfunction of the NMDAR is associated with a wide spectrum of brain disorders that are directly related to the observed side effects of FAAH inhibitors. This finding
Flashcard 1430720482572
| status | not learned | measured difficulty | 37% [default] | last interval [days] | |||
|---|---|---|---|---|---|---|---|
| repetition number in this series | 0 | memorised on | scheduled repetition | ||||
| scheduled repetition interval | last repetition or drill |
Parent (intermediate) annotation
Open itConsumer choice theory recognizes that to consume a set of goods and services, consumers must purchase them at given market prices and with a limited income.
Original toplevel document
2. CONSUMER THEORY: FROM PREFERENCES TO DEMAND FUNCTIONSoice theory begins with a fundamental model of how consumer preferences and tastes might be represented. It explores consumers’ willingness to trade off between two goods (or two baskets of goods), both of which the consumer finds beneficial. <span>Consumer choice theory then recognizes that to consume a set of goods and services, consumers must purchase them at given market prices and with a limited income. In effect, consumer choice theory first models what the consumer would like to consume, and then it examines what the consumer can consume with limited income. Finally, by superimposing
| status | not read | reprioritisations | ||
|---|---|---|---|---|
| last reprioritisation on | suggested re-reading day | |||
| started reading on | finished reading on |
2. CONSUMER THEORY: FROM PREFERENCES TO DEMAND FUNCTIONS
o goods (or two baskets of goods), both of which the consumer finds beneficial. Consumer choice theory then recognizes that to consume a set of goods and services, consumers must purchase them at given market prices and with a limited income. <span>In effect, consumer choice theory first models what the consumer would like to consume, and then it examines what the consumer can consume with limited income. Finally, by superimposing what the consumer would like to do onto what the consumer can do, we arrive at a model of what the consumer would do under various circumstances. Then by chang
Flashcard 1430724939020
| status | not learned | measured difficulty | 37% [default] | last interval [days] | |||
|---|---|---|---|---|---|---|---|
| repetition number in this series | 0 | memorised on | scheduled repetition | ||||
| scheduled repetition interval | last repetition or drill |
Parent (intermediate) annotation
Open itIn effect, consumer choice theory first models what the consumer would like to consume, and then it examines what the consumer can consume with limited income.
Original toplevel document
2. CONSUMER THEORY: FROM PREFERENCES TO DEMAND FUNCTIONSo goods (or two baskets of goods), both of which the consumer finds beneficial. Consumer choice theory then recognizes that to consume a set of goods and services, consumers must purchase them at given market prices and with a limited income. <span>In effect, consumer choice theory first models what the consumer would like to consume, and then it examines what the consumer can consume with limited income. Finally, by superimposing what the consumer would like to do onto what the consumer can do, we arrive at a model of what the consumer would do under various circumstances. Then by chang
| status | not read | reprioritisations | ||
|---|---|---|---|---|
| last reprioritisation on | suggested re-reading day | |||
| started reading on | finished reading on |
2. CONSUMER THEORY: FROM PREFERENCES TO DEMAND FUNCTIONS
es, consumers must purchase them at given market prices and with a limited income. In effect, consumer choice theory first models what the consumer would like to consume, and then it examines what the consumer can consume with limited income. <span>Finally, by superimposing what the consumer would like to do onto what the consumer can do, we arrive at a model of what the consumer would do under various circumstances. Then by changing prices and income, the model develops consumer demand as a logical extension of consumer choice theory. Although consumer choice theory attempts to model consumers’ preferences or tastes, it does not have much to say about why consumers have the tastes and preferences they ha
| status | not read | reprioritisations | ||
|---|---|---|---|---|
| last reprioritisation on | suggested re-reading day | |||
| started reading on | finished reading on |
2. CONSUMER THEORY: FROM PREFERENCES TO DEMAND FUNCTIONS
to what the consumer can do, we arrive at a model of what the consumer would do under various circumstances. Then by changing prices and income, the model develops consumer demand as a logical extension of consumer choice theory. <span>Although consumer choice theory attempts to model consumers’ preferences or tastes, it does not have much to say about why consumers have the tastes and preferences they have. It still makes assumptions, but does so at a more fundamental level. Instead of assuming the existence of a demand curve, it derives a demand curve as an implication of assumptions abou
Flashcard 1430729657612
| status | not learned | measured difficulty | 37% [default] | last interval [days] | |||
|---|---|---|---|---|---|---|---|
| repetition number in this series | 0 | memorised on | scheduled repetition | ||||
| scheduled repetition interval | last repetition or drill |
Parent (intermediate) annotation
Open it1 Gauss’s law for electric fields In Maxwell’s Equations, you’ll encounter two kinds of electric field: the electrostatic field produced by electric charge and the induced electric field produced by a changing magnetic field.
Original toplevel document (pdf)
cannot see any pdfsFlashcard 1430731230476
| status | not learned | measured difficulty | 37% [default] | last interval [days] | |||
|---|---|---|---|---|---|---|---|
| repetition number in this series | 0 | memorised on | scheduled repetition | ||||
| scheduled repetition interval | last repetition or drill |
Parent (intermediate) annotation
Open itAlthough consumer choice theory attempts to model consumers’ preferences or tastes, it does not have much to say about why consumers have the tastes and preferences they have.
Original toplevel document
2. CONSUMER THEORY: FROM PREFERENCES TO DEMAND FUNCTIONSto what the consumer can do, we arrive at a model of what the consumer would do under various circumstances. Then by changing prices and income, the model develops consumer demand as a logical extension of consumer choice theory. <span>Although consumer choice theory attempts to model consumers’ preferences or tastes, it does not have much to say about why consumers have the tastes and preferences they have. It still makes assumptions, but does so at a more fundamental level. Instead of assuming the existence of a demand curve, it derives a demand curve as an implication of assumptions abou
Flashcard 1430732803340
| status | not learned | measured difficulty | 37% [default] | last interval [days] | |||
|---|---|---|---|---|---|---|---|
| repetition number in this series | 0 | memorised on | scheduled repetition | ||||
| scheduled repetition interval | last repetition or drill |
Parent (intermediate) annotation
Open it1 Gauss’s law for electric fields In Maxwell’s Equations, you’ll encounter two kinds of electric field: the electrostatic field produced by electric charge and the induced electric field produced by a changing magnetic field.
Original toplevel document (pdf)
cannot see any pdfs| status | not read | reprioritisations | ||
|---|---|---|---|---|
| last reprioritisation on | suggested re-reading day | |||
| started reading on | finished reading on |
2. CONSUMER THEORY: FROM PREFERENCES TO DEMAND FUNCTIONS
and as a logical extension of consumer choice theory. Although consumer choice theory attempts to model consumers’ preferences or tastes, it does not have much to say about why consumers have the tastes and preferences they have. <span>It still makes assumptions, but does so at a more fundamental level. Instead of assuming the existence of a demand curve, it derives a demand curve as an implication of assumptions about preferences. Note that economists are not attempting to predict the behavior of any single consumer in any given circumstance. Instead, they are attempting to build a consistent model of aggregate m
Flashcard 1430735949068
| status | not learned | measured difficulty | 37% [default] | last interval [days] | |||
|---|---|---|---|---|---|---|---|
| repetition number in this series | 0 | memorised on | scheduled repetition | ||||
| scheduled repetition interval | last repetition or drill |
Parent (intermediate) annotation
Open itElectric charge produces an electric field, and the flux of that field passing through any closed surface is proportional to the total charge contained within that surface.
Original toplevel document (pdf)
cannot see any pdfsFlashcard 1430738308364
| status | not learned | measured difficulty | 37% [default] | last interval [days] | |||
|---|---|---|---|---|---|---|---|
| repetition number in this series | 0 | memorised on | scheduled repetition | ||||
| scheduled repetition interval | last repetition or drill |
Parent (intermediate) annotation
Open itElectric charge produces an electric field, and the flux of that field passing through any closed surface is proportional to the total charge contained within that surface.
Original toplevel document (pdf)
cannot see any pdfs| status | not read | reprioritisations | ||
|---|---|---|---|---|
| last reprioritisation on | suggested re-reading day | |||
| started reading on | finished reading on |
Parent (intermediate) annotation
Open itElectric field lines must originate on positive charge and terminate on negative charge. The net electric field at any point is the vector sum of all electric fields present at that point. Electric field lines can never cross, since that would indicate that the field p
Original toplevel document (pdf)
cannot see any pdfs| status | not read | reprioritisations | ||
|---|---|---|---|---|
| last reprioritisation on | suggested re-reading day | |||
| started reading on | finished reading on |
Parent (intermediate) annotation
Open itElectric field lines must originate on positive charge and terminate on negative charge. The net electric field at any point is the vector sum of all electric fields present at that point. Electric field lines can never cross, since that would indicate that the field points in two different directions at the same location
Original toplevel document (pdf)
cannot see any pdfs| status | not read | reprioritisations | ||
|---|---|---|---|---|
| last reprioritisation on | suggested re-reading day | |||
| started reading on | finished reading on |
2. CONSUMER THEORY: FROM PREFERENCES TO DEMAND FUNCTIONS
astes and preferences they have. It still makes assumptions, but does so at a more fundamental level. Instead of assuming the existence of a demand curve, it derives a demand curve as an implication of assumptions about preferences. Note that <span>economists are not attempting to predict the behavior of any single consumer in any given circumstance. Instead, they are attempting to build a consistent model of aggregate market behavior in the form of a market demand curve. Once we model the consumer’s preferences, we then recognize that consumption is governed not only by preferences but also by the consumer’s budget constraint (the ability
| status | not read | reprioritisations | ||
|---|---|---|---|---|
| last reprioritisation on | suggested re-reading day | |||
| started reading on | finished reading on |
2. CONSUMER THEORY: FROM PREFERENCES TO DEMAND FUNCTIONS
t economists are not attempting to predict the behavior of any single consumer in any given circumstance. Instead, they are attempting to build a consistent model of aggregate market behavior in the form of a market demand curve. <span>Once we model the consumer’s preferences, we then recognize that consumption is governed not only by preferences but also by the consumer’s budget constraint (the ability to purchase various combinations of goods and services, given his or her income). Putting preference theory together with the budget constraint gives us the demand curve we are seeking. In the following sections, we explore these topics in turn. <span><
Flashcard 1430749056268
| status | not learned | measured difficulty | 37% [default] | last interval [days] | |||
|---|---|---|---|---|---|---|---|
| repetition number in this series | 0 | memorised on | scheduled repetition | ||||
| scheduled repetition interval | last repetition or drill |
Parent (intermediate) annotation
Open itOnce we model the consumer’s preferences, we then recognize that consumption is governed not only by preferences but also by the consumer’s budget constraint (the ability to purchase various combinations of goods and services, given his or her income).
Original toplevel document
2. CONSUMER THEORY: FROM PREFERENCES TO DEMAND FUNCTIONSt economists are not attempting to predict the behavior of any single consumer in any given circumstance. Instead, they are attempting to build a consistent model of aggregate market behavior in the form of a market demand curve. <span>Once we model the consumer’s preferences, we then recognize that consumption is governed not only by preferences but also by the consumer’s budget constraint (the ability to purchase various combinations of goods and services, given his or her income). Putting preference theory together with the budget constraint gives us the demand curve we are seeking. In the following sections, we explore these topics in turn. <span><
| status | not read | reprioritisations | ||
|---|---|---|---|---|
| last reprioritisation on | suggested re-reading day | |||
| started reading on | finished reading on |
2. CONSUMER THEORY: FROM PREFERENCES TO DEMAND FUNCTIONS
l the consumer’s preferences, we then recognize that consumption is governed not only by preferences but also by the consumer’s budget constraint (the ability to purchase various combinations of goods and services, given his or her income). <span>Putting preference theory together with the budget constraint gives us the demand curve we are seeking. In the following sections, we explore these topics in turn. <span><body><html>
Flashcard 1430757182732
| status | not learned | measured difficulty | 37% [default] | last interval [days] | |||
|---|---|---|---|---|---|---|---|
| repetition number in this series | 0 | memorised on | scheduled repetition | ||||
| scheduled repetition interval | last repetition or drill |
Parent (intermediate) annotation
Open itPutting preference theory together with the budget constraint gives us the demand curve we are seeking.
Original toplevel document
2. CONSUMER THEORY: FROM PREFERENCES TO DEMAND FUNCTIONSl the consumer’s preferences, we then recognize that consumption is governed not only by preferences but also by the consumer’s budget constraint (the ability to purchase various combinations of goods and services, given his or her income). <span>Putting preference theory together with the budget constraint gives us the demand curve we are seeking. In the following sections, we explore these topics in turn. <span><body><html>
Article 1430758755596
3. UTILITY THEORY: MODELING PREFERENCES AND TASTES
#cfa #cfa-level-1 #economics #microeconomics #reading-14-demand-and-supply-analysis-consumer-demand #section-3-utility-theory #study-session-4
At the foundation of consumer behavior theory is the assumption that the consumer knows his or her own tastes and preferences and tends to take rational actions that result in a more preferred consumption “bundle” over a less preferred bundle. To build a consistent model of consumer choice, we need to begin with a few assumptions about preferences. 3.1. Axioms of the Theory of Consumer Choice First, let us be clear about the consumption opportunities over which the consumer is assumed to have preferences. We define a consumption bundle or consumption basket as a specific combination of the goods and services that the consumer would like to consume. We could almost literally conceive of a basket containing a given amount of, say, shoes, pizza, medical care, theater tickets, piano lessons, and all the other things that a consumer might enjoy consuming. Each of those goods and services can be represented in a given basket by a non-negative quantity, respectively, of all the possible goods and
| status | not read | reprioritisations | ||
|---|---|---|---|---|
| last reprioritisation on | suggested re-reading day | |||
| started reading on | finished reading on |
3. UTILITY THEORY: MODELING PREFERENCES AND TASTES
At the foundation of consumer behavior theory is the assumption that the consumer knows his or her own tastes and preferences and tends to take rational actions that result in a more preferred consumption “bundle” over a less preferred bundle. To build a consistent model of consumer choice, we need to begin with a few assumptions about preferences. 3.1. Axioms of the Theory of Consumer Choice
Flashcard 1430763998476
| status | not learned | measured difficulty | 37% [default] | last interval [days] | |||
|---|---|---|---|---|---|---|---|
| repetition number in this series | 0 | memorised on | scheduled repetition | ||||
| scheduled repetition interval | last repetition or drill |
Parent (intermediate) annotation
Open itAt the foundation of consumer behavior theory is the assumption that the consumer knows his or her own tastes and preferences and tends to take rational actions that result in a more preferred consumption “bundle” over a less preferred bundle.
Original toplevel document
3. UTILITY THEORY: MODELING PREFERENCES AND TASTESAt the foundation of consumer behavior theory is the assumption that the consumer knows his or her own tastes and preferences and tends to take rational actions that result in a more preferred consumption “bundle” over a less preferred bundle. To build a consistent model of consumer choice, we need to begin with a few assumptions about preferences. 3.1. Axioms of the Theory of Consumer Choice
| status | not read | reprioritisations | ||
|---|---|---|---|---|
| last reprioritisation on | suggested re-reading day | |||
| started reading on | finished reading on |
3. UTILITY THEORY: MODELING PREFERENCES AND TASTES
t the foundation of consumer behavior theory is the assumption that the consumer knows his or her own tastes and preferences and tends to take rational actions that result in a more preferred consumption “bundle” over a less preferred bundle. <span>To build a consistent model of consumer choice, we need to begin with a few assumptions about preferences. 3.1. Axioms of the Theory of Consumer Choice First, let us be clear about the consumption opportunities over which the consumer is assumed to have prefe
Flashcard 1430768192780
| status | not learned | measured difficulty | 37% [default] | last interval [days] | |||
|---|---|---|---|---|---|---|---|
| repetition number in this series | 0 | memorised on | scheduled repetition | ||||
| scheduled repetition interval | last repetition or drill |
Parent (intermediate) annotation
Open itTo build a consistent model of consumer choice, we need to begin with the axioms of the theory of consumer choice
Original toplevel document
3. UTILITY THEORY: MODELING PREFERENCES AND TASTESt the foundation of consumer behavior theory is the assumption that the consumer knows his or her own tastes and preferences and tends to take rational actions that result in a more preferred consumption “bundle” over a less preferred bundle. <span>To build a consistent model of consumer choice, we need to begin with a few assumptions about preferences. 3.1. Axioms of the Theory of Consumer Choice First, let us be clear about the consumption opportunities over which the consumer is assumed to have prefe
| status | not read | reprioritisations | ||
|---|---|---|---|---|
| last reprioritisation on | suggested re-reading day | |||
| started reading on | finished reading on |
| status | not read | reprioritisations | ||
|---|---|---|---|---|
| last reprioritisation on | suggested re-reading day | |||
| started reading on | finished reading on |
| status | not read | reprioritisations | ||
|---|---|---|---|---|
| last reprioritisation on | suggested re-reading day | |||
| started reading on | finished reading on |
Parent (intermediate) annotation
Open itSubstancje zawierają energię cieplną, aż do temperatury zera absolutnego (0 K = -273,15°C).
Original toplevel document (pdf)
cannot see any pdfsFlashcard 1430780775692
| status | not learned | measured difficulty | 37% [default] | last interval [days] | |||
|---|---|---|---|---|---|---|---|
| repetition number in this series | 0 | memorised on | scheduled repetition | ||||
| scheduled repetition interval | last repetition or drill |
Parent (intermediate) annotation
Open itSubstancje zawierają energię cieplną, aż do temperatury zera absolutnego (0 K = -273,15°C).
Original toplevel document (pdf)
cannot see any pdfsFlashcard 1430782348556
| status | not learned | measured difficulty | 37% [default] | last interval [days] | |||
|---|---|---|---|---|---|---|---|
| repetition number in this series | 0 | memorised on | scheduled repetition | ||||
| scheduled repetition interval | last repetition or drill |
Parent (intermediate) annotation
Open itzero absolutne to 0 K lub -273,15°C
Original toplevel document (pdf)
cannot see any pdfsFlashcard 1430783921420
| status | not learned | measured difficulty | 37% [default] | last interval [days] | |||
|---|---|---|---|---|---|---|---|
| repetition number in this series | 0 | memorised on | scheduled repetition | ||||
| scheduled repetition interval | last repetition or drill |
Parent (intermediate) annotation
Open itzero absolutne to 0 K lub -273,15°C
Original toplevel document (pdf)
cannot see any pdfs| status | not read | reprioritisations | ||
|---|---|---|---|---|
| last reprioritisation on | suggested re-reading day | |||
| started reading on | finished reading on |
3. UTILITY THEORY: MODELING PREFERENCES AND TASTES
o begin with a few assumptions about preferences. 3.1. Axioms of the Theory of Consumer Choice First, let us be clear about the consumption opportunities over which the consumer is assumed to have preferences. <span>We define a consumption bundle or consumption basket as a specific combination of the goods and services that the consumer would like to consume. We could almost literally conceive of a basket containing a given amount of, say, shoes, pizza, medical care, theater tickets, piano lessons, and all the other things that a consumer mi
| status | not read | reprioritisations | ||
|---|---|---|---|---|
| last reprioritisation on | suggested re-reading day | |||
| started reading on | finished reading on |
3. UTILITY THEORY: MODELING PREFERENCES AND TASTES
about the consumption opportunities over which the consumer is assumed to have preferences. We define a consumption bundle or consumption basket as a specific combination of the goods and services that the consumer would like to consume. <span>We could almost literally conceive of a basket containing a given amount of, say, shoes, pizza, medical care, theater tickets, piano lessons, and all the other things that a consumer might enjoy consuming. Each of those goods and services can be represented in a given basket by a non-negative quantity, respectively, of all the possible goods and services. Any given basket could have zero of one or more of those goods. A distinctly different consumption bundle would contain all of the same goods but in different quantities, again allowing for the possibility of a zero quantity of one or more of the go
| status | not read | reprioritisations | ||
|---|---|---|---|---|
| last reprioritisation on | suggested re-reading day | |||
| started reading on | finished reading on |
3. UTILITY THEORY: MODELING PREFERENCES AND TASTES
mer might enjoy consuming. Each of those goods and services can be represented in a given basket by a non-negative quantity, respectively, of all the possible goods and services. Any given basket could have zero of one or more of those goods. <span>A distinctly different consumption bundle would contain all of the same goods but in different quantities, again allowing for the possibility of a zero quantity of one or more of the goods. For example, bundle Amight have the same amount of all but one of the goods and services as bundle B but a different amount of that one. Bundles A and B would be considered two distinct
Flashcard 1430795193612
| status | not learned | measured difficulty | 37% [default] | last interval [days] | |||
|---|---|---|---|---|---|---|---|
| repetition number in this series | 0 | memorised on | scheduled repetition | ||||
| scheduled repetition interval | last repetition or drill |
Parent (intermediate) annotation
Open itA distinctly different consumption bundle would contain all of the same goods but in different quantities, again allowing for the possibility of a zero quantity of one or more of the goods.
Original toplevel document
3. UTILITY THEORY: MODELING PREFERENCES AND TASTESmer might enjoy consuming. Each of those goods and services can be represented in a given basket by a non-negative quantity, respectively, of all the possible goods and services. Any given basket could have zero of one or more of those goods. <span>A distinctly different consumption bundle would contain all of the same goods but in different quantities, again allowing for the possibility of a zero quantity of one or more of the goods. For example, bundle Amight have the same amount of all but one of the goods and services as bundle B but a different amount of that one. Bundles A and B would be considered two distinct
| status | not read | reprioritisations | ||
|---|---|---|---|---|
| last reprioritisation on | suggested re-reading day | |||
| started reading on | finished reading on |
3. UTILITY THEORY: MODELING PREFERENCES AND TASTES
ave zero of one or more of those goods. A distinctly different consumption bundle would contain all of the same goods but in different quantities, again allowing for the possibility of a zero quantity of one or more of the goods. For example, <span>bundle Amight have the same amount of all but one of the goods and services as bundle B but a different amount of that one. Bundles A and B would be considered two distinct bundles. Given this understanding of consumption bundles, the first assumption we make about a given consumer’s preferences is simply that she is able to make a comparison between a
| status | not read | reprioritisations | ||
|---|---|---|---|---|
| last reprioritisation on | suggested re-reading day | |||
| started reading on | finished reading on |
3. UTILITY THEORY: MODELING PREFERENCES AND TASTES
ntity of one or more of the goods. For example, bundle Amight have the same amount of all but one of the goods and services as bundle B but a different amount of that one. Bundles A and B would be considered two distinct bundles. <span>Given this understanding of consumption bundles, the first assumption we make about a given consumer’s preferences is simply that she is able to make a comparison between any two possible bundles. That is, given bundles A and B, she must be able to say either that she prefers A to B, or she prefers B to A, or she is indifferentbetween the two. This is the assumption of complete preferences (also known as the axiom of completeness), and although it does not appear to be a particularly strong assumption, it is not trivial either. It rules out the possibility that she could just say, “I recognize that the two bundles are different, but in fact they are so different that I simply cannot compare them at all.” A lov
Flashcard 1430802271500
| status | not learned | measured difficulty | 37% [default] | last interval [days] | |||
|---|---|---|---|---|---|---|---|
| repetition number in this series | 0 | memorised on | scheduled repetition | ||||
| scheduled repetition interval | last repetition or drill |
Parent (intermediate) annotation
Open itGiven the understanding of consumption bundles (what defines a bundle), the first assumption we make about a given consumer’s preferences is simply that she is able to make a comparison between any two possible bundles. That is, given bundles A and B, she must be able to say either that she prefers A to B, or she prefers B to A, or she is indifferentbetween the two. This is the assumption of complete
Original toplevel document
3. UTILITY THEORY: MODELING PREFERENCES AND TASTESntity of one or more of the goods. For example, bundle Amight have the same amount of all but one of the goods and services as bundle B but a different amount of that one. Bundles A and B would be considered two distinct bundles. <span>Given this understanding of consumption bundles, the first assumption we make about a given consumer’s preferences is simply that she is able to make a comparison between any two possible bundles. That is, given bundles A and B, she must be able to say either that she prefers A to B, or she prefers B to A, or she is indifferentbetween the two. This is the assumption of complete preferences (also known as the axiom of completeness), and although it does not appear to be a particularly strong assumption, it is not trivial either. It rules out the possibility that she could just say, “I recognize that the two bundles are different, but in fact they are so different that I simply cannot compare them at all.” A lov
Flashcard 1430804630796
| status | not learned | measured difficulty | 37% [default] | last interval [days] | |||
|---|---|---|---|---|---|---|---|
| repetition number in this series | 0 | memorised on | scheduled repetition | ||||
| scheduled repetition interval | last repetition or drill |
Parent (intermediate) annotation
Open itshe is able to make a comparison between any two possible bundles. That is, given bundles A and B, she must be able to say either that she prefers A to B, or she prefers B to A, or she is indifferentbetween the two. This is the assumption of <span>complete preferences (also known as the axiom of completeness), and although it does not appear to be a particularly strong assumption, it is not trivial either.<span><body><html>
Original toplevel document
3. UTILITY THEORY: MODELING PREFERENCES AND TASTESntity of one or more of the goods. For example, bundle Amight have the same amount of all but one of the goods and services as bundle B but a different amount of that one. Bundles A and B would be considered two distinct bundles. <span>Given this understanding of consumption bundles, the first assumption we make about a given consumer’s preferences is simply that she is able to make a comparison between any two possible bundles. That is, given bundles A and B, she must be able to say either that she prefers A to B, or she prefers B to A, or she is indifferentbetween the two. This is the assumption of complete preferences (also known as the axiom of completeness), and although it does not appear to be a particularly strong assumption, it is not trivial either. It rules out the possibility that she could just say, “I recognize that the two bundles are different, but in fact they are so different that I simply cannot compare them at all.” A lov
| status | not read | reprioritisations | ||
|---|---|---|---|---|
| last reprioritisation on | suggested re-reading day | |||
| started reading on | finished reading on |
| status | not read | reprioritisations | ||
|---|---|---|---|---|
| last reprioritisation on | suggested re-reading day | |||
| started reading on | finished reading on |
3. UTILITY THEORY: MODELING PREFERENCES AND TASTES
refers B to A, or she is indifferentbetween the two. This is the assumption of complete preferences (also known as the axiom of completeness), and although it does not appear to be a particularly strong assumption, it is not trivial either. <span>It rules out the possibility that she could just say, “I recognize that the two bundles are different, but in fact they are so different that I simply cannot compare them at all.” A loving father might very well say that about his two children. In effect, the father neither prefers one to the other nor is, in any meaningful sense, indifferent between the two. The
| status | not read | reprioritisations | ||
|---|---|---|---|---|
| last reprioritisation on | suggested re-reading day | |||
| started reading on | finished reading on |
| status | not read | reprioritisations | ||
|---|---|---|---|---|
| last reprioritisation on | suggested re-reading day | |||
| started reading on | finished reading on |
3. UTILITY THEORY: MODELING PREFERENCES AND TASTES
that about his two children. In effect, the father neither prefers one to the other nor is, in any meaningful sense, indifferent between the two. The assumption of complete preferences cannot accommodate such a response. Second, <span>we assume that when comparing any three distinct bundles, A, B, and C, if A is preferred to B, and simultaneously B is preferred to C, then it must be true that A is preferred to C. This assumption is referred to as the assumption of transitive preferences , and it is assumed to hold for indifference as well as for strict preference. This is a somewhat stronger assumption because it is essentially an assumption of rationality. We would say that if a consumer prefers a skiing holiday to a diving holiday and a diving
| status | not read | reprioritisations | ||
|---|---|---|---|---|
| last reprioritisation on | suggested re-reading day | |||
| started reading on | finished reading on |
Flashcard 1430814854412
| status | not learned | measured difficulty | 37% [default] | last interval [days] | |||
|---|---|---|---|---|---|---|---|
| repetition number in this series | 0 | memorised on | scheduled repetition | ||||
| scheduled repetition interval | last repetition or drill |
Parent (intermediate) annotation
Open itan>We assume that when comparing any three distinct bundles, A, B, and C, if A is preferred to B, and simultaneously B is preferred to C, then it must be true that A is preferred to C. This assumption is referred to as the assumption of transitive preferences , and it is assumed to hold for indifference as well as for strict preference.<span><body><html>
Original toplevel document
3. UTILITY THEORY: MODELING PREFERENCES AND TASTESthat about his two children. In effect, the father neither prefers one to the other nor is, in any meaningful sense, indifferent between the two. The assumption of complete preferences cannot accommodate such a response. Second, <span>we assume that when comparing any three distinct bundles, A, B, and C, if A is preferred to B, and simultaneously B is preferred to C, then it must be true that A is preferred to C. This assumption is referred to as the assumption of transitive preferences , and it is assumed to hold for indifference as well as for strict preference. This is a somewhat stronger assumption because it is essentially an assumption of rationality. We would say that if a consumer prefers a skiing holiday to a diving holiday and a diving
| status | not read | reprioritisations | ||
|---|---|---|---|---|
| last reprioritisation on | suggested re-reading day | |||
| started reading on | finished reading on |
3. UTILITY THEORY: MODELING PREFERENCES AND TASTES
and simultaneously B is preferred to C, then it must be true that A is preferred to C. This assumption is referred to as the assumption of transitive preferences , and it is assumed to hold for indifference as well as for strict preference. <span>This is a somewhat stronger assumption because it is essentially an assumption of rationality. We would say that if a consumer prefers a skiing holiday to a diving holiday and a diving holiday to a backpacking holiday and at the same time prefers a backpacking holiday to a skiing
| status | not read | reprioritisations | ||
|---|---|---|---|---|
| last reprioritisation on | suggested re-reading day | |||
| started reading on | finished reading on |
3. UTILITY THEORY: MODELING PREFERENCES AND TASTES
sumption is referred to as the assumption of transitive preferences , and it is assumed to hold for indifference as well as for strict preference. This is a somewhat stronger assumption because it is essentially an assumption of rationality. <span>We would say that if a consumer prefers a skiing holiday to a diving holiday and a diving holiday to a backpacking holiday and at the same time prefers a backpacking holiday to a skiing holiday, then he is acting irrationally. Transitivity rules out this kind of inconsistency. If you have studied psychology, however, you will no doubt have seen experiments that show subjects violating this assumption, especially in cases of many complex options being offered to them. When we state these axioms, we are not saying that we believe them actually to be true in every instance, but we assume them for the sake of building a model. A model is a
| status | not read | reprioritisations | ||
|---|---|---|---|---|
| last reprioritisation on | suggested re-reading day | |||
| started reading on | finished reading on |
3. UTILITY THEORY: MODELING PREFERENCES AND TASTES
les out this kind of inconsistency. If you have studied psychology, however, you will no doubt have seen experiments that show subjects violating this assumption, especially in cases of many complex options being offered to them. <span>When we state these axioms, we are not saying that we believe them actually to be true in every instance, but we assume them for the sake of building a model. A model is a simplification of the real world phenomena we are trying to understand. Necessarily, axioms must be at some level inaccurate and incomplete representations of the phenomen
| status | not read | reprioritisations | ||
|---|---|---|---|---|
| last reprioritisation on | suggested re-reading day | |||
| started reading on | finished reading on |
3. UTILITY THEORY: MODELING PREFERENCES AND TASTES
on, especially in cases of many complex options being offered to them. When we state these axioms, we are not saying that we believe them actually to be true in every instance, but we assume them for the sake of building a model. <span>A model is a simplification of the real world phenomena we are trying to understand. Necessarily, axioms must be at some level inaccurate and incomplete representations of the phenomena we are trying to model. If that were not the case, the “model” would not be a simpli
| status | not read | reprioritisations | ||
|---|---|---|---|---|
| last reprioritisation on | suggested re-reading day | |||
| started reading on | finished reading on |
3. UTILITY THEORY: MODELING PREFERENCES AND TASTES
hen we state these axioms, we are not saying that we believe them actually to be true in every instance, but we assume them for the sake of building a model. A model is a simplification of the real world phenomena we are trying to understand. <span>Necessarily, axioms must be at some level inaccurate and incomplete representations of the phenomena we are trying to model. If that were not the case, the “model” would not be a simplification; it would be a reflection of the complex system we are attempting to model and thus would not help our understanding very much. Finally, we usually assume that in at least one of the goods, the consumer could never have so much that she would refuse any more, even if it were free. This assumption is
| status | not read | reprioritisations | ||
|---|---|---|---|---|
| last reprioritisation on | suggested re-reading day | |||
| started reading on | finished reading on |
3. UTILITY THEORY: MODELING PREFERENCES AND TASTES
henomena we are trying to model. If that were not the case, the “model” would not be a simplification; it would be a reflection of the complex system we are attempting to model and thus would not help our understanding very much. <span>Finally, we usually assume that in at least one of the goods, the consumer could never have so much that she would refuse any more, even if it were free. This assumption is sometimes referred to as the “more is better” assumption or the assumption of non-satiation . Clearly, for some things, more is worse, such as air pollution or trash. In those cases, the good is then the removal of that bad, so we can usually reframe our model to accommodate the
Flashcard 1430830845196
| status | not learned | measured difficulty | 37% [default] | last interval [days] | |||
|---|---|---|---|---|---|---|---|
| repetition number in this series | 0 | memorised on | scheduled repetition | ||||
| scheduled repetition interval | last repetition or drill |
Parent (intermediate) annotation
Open itwe usually assume that in at least one of the goods, the consumer could never have so much that she would refuse any more, even if it were free. This assumption is sometimes referred to as the “more is better” assumption or the assumption of <span>non-satiation .<span><body><html>
Original toplevel document
3. UTILITY THEORY: MODELING PREFERENCES AND TASTEShenomena we are trying to model. If that were not the case, the “model” would not be a simplification; it would be a reflection of the complex system we are attempting to model and thus would not help our understanding very much. <span>Finally, we usually assume that in at least one of the goods, the consumer could never have so much that she would refuse any more, even if it were free. This assumption is sometimes referred to as the “more is better” assumption or the assumption of non-satiation . Clearly, for some things, more is worse, such as air pollution or trash. In those cases, the good is then the removal of that bad, so we can usually reframe our model to accommodate the
| status | not read | reprioritisations | ||
|---|---|---|---|---|
| last reprioritisation on | suggested re-reading day | |||
| started reading on | finished reading on |
3. UTILITY THEORY: MODELING PREFERENCES AND TASTES
e that in at least one of the goods, the consumer could never have so much that she would refuse any more, even if it were free. This assumption is sometimes referred to as the “more is better” assumption or the assumption of non-satiation . <span>Clearly, for some things, more is worse, such as air pollution or trash. In those cases, the good is then the removal of that bad, so we can usually reframe our model to accommodate the non-satiation assumption. In particular, when we later discuss the concept of risk for an investor, we will recognize that for many, more risk is worse than less risk, all else being equal. In that analysis, we
| status | not read | reprioritisations | ||
|---|---|---|---|---|
| last reprioritisation on | suggested re-reading day | |||
| started reading on | finished reading on |
3. UTILITY THEORY: MODELING PREFERENCES AND TASTES
non-satiation . Clearly, for some things, more is worse, such as air pollution or trash. In those cases, the good is then the removal of that bad, so we can usually reframe our model to accommodate the non-satiation assumption. In particular, <span>when we later discuss the concept of risk for an investor, we will recognize that for many, more risk is worse than less risk, all else being equal. In that analysis, we shall model the willingness of the investor to trade off between increased investment returns and increased certainty, which is the absence of risk. EXAMPLE 1 Axioms Concerning Preferences Helen Smith enjoys, among other things, eating sausages. She also enjoys reading Marcel Proust. Smith is co
| status | not read | reprioritisations | ||
|---|---|---|---|---|
| last reprioritisation on | suggested re-reading day | |||
| started reading on | finished reading on |
3. UTILITY THEORY: MODELING PREFERENCES AND TASTES
at analysis, we shall model the willingness of the investor to trade off between increased investment returns and increased certainty, which is the absence of risk. EXAMPLE 1 Axioms Concerning Preferences <span>Helen Smith enjoys, among other things, eating sausages. She also enjoys reading Marcel Proust. Smith is confronted with two baskets: Basket A, which contains several other goods and a package of sausages, and B, which contains identical quantities of the other goods as Basket A, but instead of the sausages, it contains a book by Proust. When asked which basket she prefers, she replies, “I like them both, but sausages and a book by Proust are so different that I simply cannot compare the two baskets.” Determine whether Smith is obeying all the axioms of preference theory. Solution: Smith is violating the assumption of complete preferences. This assumption states that a consumer must be able to compare any two baskets of goods, either preferring one to the other or being indifferent between the two. If she complies with th
Flashcard 1430838971660
| status | not learned | measured difficulty | 37% [default] | last interval [days] | |||
|---|---|---|---|---|---|---|---|
| repetition number in this series | 0 | memorised on | scheduled repetition | ||||
| scheduled repetition interval | last repetition or drill |
Parent (intermediate) annotation
Open itrs, he replies, “I like them both, but sausages and a book by Shakespeare are so different that I cannot compare the two baskets.” Determine whether Bomber is obeying all the axioms of preference theory. Solution: <span>Smith is violating the assumption of complete preferences. <span><body><html>
Original toplevel document
3. UTILITY THEORY: MODELING PREFERENCES AND TASTESat analysis, we shall model the willingness of the investor to trade off between increased investment returns and increased certainty, which is the absence of risk. EXAMPLE 1 Axioms Concerning Preferences <span>Helen Smith enjoys, among other things, eating sausages. She also enjoys reading Marcel Proust. Smith is confronted with two baskets: Basket A, which contains several other goods and a package of sausages, and B, which contains identical quantities of the other goods as Basket A, but instead of the sausages, it contains a book by Proust. When asked which basket she prefers, she replies, “I like them both, but sausages and a book by Proust are so different that I simply cannot compare the two baskets.” Determine whether Smith is obeying all the axioms of preference theory. Solution: Smith is violating the assumption of complete preferences. This assumption states that a consumer must be able to compare any two baskets of goods, either preferring one to the other or being indifferent between the two. If she complies with th
| status | not read | reprioritisations | ||
|---|---|---|---|---|
| last reprioritisation on | suggested re-reading day | |||
| started reading on | finished reading on |
3. UTILITY THEORY: MODELING PREFERENCES AND TASTES
ifferent between the two. If she complies with this assumption, she must be able to compare these two baskets of goods. 3.2. Representing the Preference of a Consumer: The Utility Function <span>Armed with the assumptions of completeness, transitivity, and non-satiation, we ask whether there might be a way for a given consumer to represent his own preferences in a consistent manner. Let us consider presenting him with all possible bundles of all the possible goods and services he could consider. Now suppose we give him paper and pencil and ask him to assign a number to each of the bundles. (The assumption of completeness ensures that he, in fact, could do that.) All he must do is write a number on a paper and lay it on each of the bundles. The only restrictions are these: Comparing any two bundles, if he prefers one to the other, he must assign a higher number to the bundle he prefers. And if he is indifferent between them, he must assign the same number to both. Other than that, he is free to begin with any number he wants for the first bundle he considers. In this way, he is simply ordering the bundles according to his preferences over them. Of course, each of these possible bundles has a specific quantity of each of the goods and services. So, we have two sets of numbers. One set consists of the pieces of pape
| status | not read | reprioritisations | ||
|---|---|---|---|---|
| last reprioritisation on | suggested re-reading day | |||
| started reading on | finished reading on |
Parent (intermediate) annotation
Open itArmed with the assumptions of completeness, transitivity, and non-satiation, we ask whether there might be a way for a given consumer to represent his own preferences in a consistent manner. Let us consider presenting him with all possible bundles of all the possible goods and services he could consider. Now suppose we give him paper and pencil and ask him to assign a numbe
Original toplevel document
3. UTILITY THEORY: MODELING PREFERENCES AND TASTESifferent between the two. If she complies with this assumption, she must be able to compare these two baskets of goods. 3.2. Representing the Preference of a Consumer: The Utility Function <span>Armed with the assumptions of completeness, transitivity, and non-satiation, we ask whether there might be a way for a given consumer to represent his own preferences in a consistent manner. Let us consider presenting him with all possible bundles of all the possible goods and services he could consider. Now suppose we give him paper and pencil and ask him to assign a number to each of the bundles. (The assumption of completeness ensures that he, in fact, could do that.) All he must do is write a number on a paper and lay it on each of the bundles. The only restrictions are these: Comparing any two bundles, if he prefers one to the other, he must assign a higher number to the bundle he prefers. And if he is indifferent between them, he must assign the same number to both. Other than that, he is free to begin with any number he wants for the first bundle he considers. In this way, he is simply ordering the bundles according to his preferences over them. Of course, each of these possible bundles has a specific quantity of each of the goods and services. So, we have two sets of numbers. One set consists of the pieces of pape
Flashcard 1431536798988
| status | not learned | measured difficulty | 37% [default] | last interval [days] | |||
|---|---|---|---|---|---|---|---|
| repetition number in this series | 0 | memorised on | scheduled repetition | ||||
| scheduled repetition interval | last repetition or drill |
Parent (intermediate) annotation
Open itArmed with the assumptions of completeness, transitivity, and non-satiation, we ask whether there might be a way for a given consumer to represent his own preferences in a consistent manner.
Original toplevel document
3. UTILITY THEORY: MODELING PREFERENCES AND TASTESifferent between the two. If she complies with this assumption, she must be able to compare these two baskets of goods. 3.2. Representing the Preference of a Consumer: The Utility Function <span>Armed with the assumptions of completeness, transitivity, and non-satiation, we ask whether there might be a way for a given consumer to represent his own preferences in a consistent manner. Let us consider presenting him with all possible bundles of all the possible goods and services he could consider. Now suppose we give him paper and pencil and ask him to assign a number to each of the bundles. (The assumption of completeness ensures that he, in fact, could do that.) All he must do is write a number on a paper and lay it on each of the bundles. The only restrictions are these: Comparing any two bundles, if he prefers one to the other, he must assign a higher number to the bundle he prefers. And if he is indifferent between them, he must assign the same number to both. Other than that, he is free to begin with any number he wants for the first bundle he considers. In this way, he is simply ordering the bundles according to his preferences over them. Of course, each of these possible bundles has a specific quantity of each of the goods and services. So, we have two sets of numbers. One set consists of the pieces of pape
| status | not read | reprioritisations | ||
|---|---|---|---|---|
| last reprioritisation on | suggested re-reading day | |||
| started reading on | finished reading on |
Parent (intermediate) annotation
Open iton-satiation, we ask whether there might be a way for a given consumer to represent his own preferences in a consistent manner. Let us consider presenting him with all possible bundles of all the possible goods and services he could consider. <span>Now suppose we give him paper and pencil and ask him to assign a number to each of the bundles. (The assumption of completeness ensures that he, in fact, could do that.) All he must do is write a number on a paper and lay it on each of the bundles. The only restrictions are these: Comparing any two bundles, if he prefers one to the other, he must assign
Original toplevel document
3. UTILITY THEORY: MODELING PREFERENCES AND TASTESifferent between the two. If she complies with this assumption, she must be able to compare these two baskets of goods. 3.2. Representing the Preference of a Consumer: The Utility Function <span>Armed with the assumptions of completeness, transitivity, and non-satiation, we ask whether there might be a way for a given consumer to represent his own preferences in a consistent manner. Let us consider presenting him with all possible bundles of all the possible goods and services he could consider. Now suppose we give him paper and pencil and ask him to assign a number to each of the bundles. (The assumption of completeness ensures that he, in fact, could do that.) All he must do is write a number on a paper and lay it on each of the bundles. The only restrictions are these: Comparing any two bundles, if he prefers one to the other, he must assign a higher number to the bundle he prefers. And if he is indifferent between them, he must assign the same number to both. Other than that, he is free to begin with any number he wants for the first bundle he considers. In this way, he is simply ordering the bundles according to his preferences over them. Of course, each of these possible bundles has a specific quantity of each of the goods and services. So, we have two sets of numbers. One set consists of the pieces of pape
| status | not read | reprioritisations | ||
|---|---|---|---|---|
| last reprioritisation on | suggested re-reading day | |||
| started reading on | finished reading on |
3. UTILITY THEORY: MODELING PREFERENCES AND TASTES
them, he must assign the same number to both. Other than that, he is free to begin with any number he wants for the first bundle he considers. In this way, he is simply ordering the bundles according to his preferences over them. <span>Of course, each of these possible bundles has a specific quantity of each of the goods and services. So, we have two sets of numbers. One set consists of the pieces of paper he has laid on the bundles. The other is the set of numerical quantities of the goods that are contained in each of the respective bundles. Under “reasonable assumptions” (the definition of which is not necessary for us to delve into at this level), it is possible to come up with a rule that translates the quantities of goo
| status | not read | reprioritisations | ||
|---|---|---|---|---|
| last reprioritisation on | suggested re-reading day | |||
| started reading on | finished reading on |
Parent (intermediate) annotation
Open itIf we ask a consumer to asseign a number to each bundle of course, each of these possible bundles has a specific quantity of each of the goods and services. So, we have two sets of numbers. One set consists of the pieces of paper he has laid on the bundles. The other is the set of numerical quantities of the goods that are contained in each
Original toplevel document
3. UTILITY THEORY: MODELING PREFERENCES AND TASTESthem, he must assign the same number to both. Other than that, he is free to begin with any number he wants for the first bundle he considers. In this way, he is simply ordering the bundles according to his preferences over them. <span>Of course, each of these possible bundles has a specific quantity of each of the goods and services. So, we have two sets of numbers. One set consists of the pieces of paper he has laid on the bundles. The other is the set of numerical quantities of the goods that are contained in each of the respective bundles. Under “reasonable assumptions” (the definition of which is not necessary for us to delve into at this level), it is possible to come up with a rule that translates the quantities of goo
Flashcard 1431547546892
| status | not learned | measured difficulty | 37% [default] | last interval [days] | |||
|---|---|---|---|---|---|---|---|
| repetition number in this series | 0 | memorised on | scheduled repetition | ||||
| scheduled repetition interval | last repetition or drill |
Parent (intermediate) annotation
Open itIf we ask a consumer to assign a number to each bundle of course, each of these possible bundles has a specific quantity of each of the goods and services.
Original toplevel document
3. UTILITY THEORY: MODELING PREFERENCES AND TASTESthem, he must assign the same number to both. Other than that, he is free to begin with any number he wants for the first bundle he considers. In this way, he is simply ordering the bundles according to his preferences over them. <span>Of course, each of these possible bundles has a specific quantity of each of the goods and services. So, we have two sets of numbers. One set consists of the pieces of paper he has laid on the bundles. The other is the set of numerical quantities of the goods that are contained in each of the respective bundles. Under “reasonable assumptions” (the definition of which is not necessary for us to delve into at this level), it is possible to come up with a rule that translates the quantities of goo
| status | not read | reprioritisations | ||
|---|---|---|---|---|
| last reprioritisation on | suggested re-reading day | |||
| started reading on | finished reading on |
Parent (intermediate) annotation
Open itIf we ask a consumer to asseign a number to each bundle of course, each of these possible bundles has a specific quantity of each of the goods and services. So, we have two sets of numbers. One set consists of the pieces of paper he has laid on the bundles. The other is the set of numerical quantities of the goods that are contained in each of the respective bundles.
Original toplevel document
3. UTILITY THEORY: MODELING PREFERENCES AND TASTESthem, he must assign the same number to both. Other than that, he is free to begin with any number he wants for the first bundle he considers. In this way, he is simply ordering the bundles according to his preferences over them. <span>Of course, each of these possible bundles has a specific quantity of each of the goods and services. So, we have two sets of numbers. One set consists of the pieces of paper he has laid on the bundles. The other is the set of numerical quantities of the goods that are contained in each of the respective bundles. Under “reasonable assumptions” (the definition of which is not necessary for us to delve into at this level), it is possible to come up with a rule that translates the quantities of goo
Flashcard 1431551479052
| status | not learned | measured difficulty | 37% [default] | last interval [days] | |||
|---|---|---|---|---|---|---|---|
| repetition number in this series | 0 | memorised on | scheduled repetition | ||||
| scheduled repetition interval | last repetition or drill |
Parent (intermediate) annotation
Open itWhen a consumer assigns a number to his prefered bundles, we have two sets of numbers. One set consists of the pieces of paper he has laid on the bundles. The other is the set of numerical quantities of the goods that are contained in each of the respective bundles.
Original toplevel document
3. UTILITY THEORY: MODELING PREFERENCES AND TASTESthem, he must assign the same number to both. Other than that, he is free to begin with any number he wants for the first bundle he considers. In this way, he is simply ordering the bundles according to his preferences over them. <span>Of course, each of these possible bundles has a specific quantity of each of the goods and services. So, we have two sets of numbers. One set consists of the pieces of paper he has laid on the bundles. The other is the set of numerical quantities of the goods that are contained in each of the respective bundles. Under “reasonable assumptions” (the definition of which is not necessary for us to delve into at this level), it is possible to come up with a rule that translates the quantities of goo
| status | not read | reprioritisations | ||
|---|---|---|---|---|
| last reprioritisation on | suggested re-reading day | |||
| started reading on | finished reading on |
3. UTILITY THEORY: MODELING PREFERENCES AND TASTES
ch of the goods and services. So, we have two sets of numbers. One set consists of the pieces of paper he has laid on the bundles. The other is the set of numerical quantities of the goods that are contained in each of the respective bundles. <span>Under “reasonable assumptions” (the definition of which is not necessary for us to delve into at this level), it is possible to come up with a rule that translates the quantities of goods in each basket into the number that our consumer has assigned to each basket. That “assignment rule” is called the utility function of that particular consumer. The single task of that utility function is to translate each basket of goods and services into a number that rank orders the baskets according to our particular consumer’s preferences.
| status | not read | reprioritisations | ||
|---|---|---|---|---|
| last reprioritisation on | suggested re-reading day | |||
| started reading on | finished reading on |
3. UTILITY THEORY: MODELING PREFERENCES AND TASTES
, it is possible to come up with a rule that translates the quantities of goods in each basket into the number that our consumer has assigned to each basket. That “assignment rule” is called the utility function of that particular consumer. <span>The single task of that utility function is to translate each basket of goods and services into a number that rank orders the baskets according to our particular consumer’s preferences. The number itself is referred to as the utility of that basket and is measured in utils , which are just quantities of happiness, or well-being, or whatever comes to mind such that more of it is better than less of it. In general, we can represent the utility function as Equation (1) U=f(Qx1,Qx2,...,Qxn) where the Qs are the quantities of each of th
Flashcard 1431559343372
| status | not learned | measured difficulty | 37% [default] | last interval [days] | |||
|---|---|---|---|---|---|---|---|
| repetition number in this series | 0 | memorised on | scheduled repetition | ||||
| scheduled repetition interval | last repetition or drill |
Parent (intermediate) annotation
Open itThe single task of the utility function is to translate each basket of goods and services into a number that rank orders the baskets according to our particular consumer’s preferences. The number itself is referred to as the utility of that basket and is measured in utils , which are just quantities of happiness, or well-being, or whatever comes to mind such that mo
Original toplevel document
3. UTILITY THEORY: MODELING PREFERENCES AND TASTES, it is possible to come up with a rule that translates the quantities of goods in each basket into the number that our consumer has assigned to each basket. That “assignment rule” is called the utility function of that particular consumer. <span>The single task of that utility function is to translate each basket of goods and services into a number that rank orders the baskets according to our particular consumer’s preferences. The number itself is referred to as the utility of that basket and is measured in utils , which are just quantities of happiness, or well-being, or whatever comes to mind such that more of it is better than less of it. In general, we can represent the utility function as Equation (1) U=f(Qx1,Qx2,...,Qxn) where the Qs are the quantities of each of th
Flashcard 1431561702668
| status | not learned | measured difficulty | 37% [default] | last interval [days] | |||
|---|---|---|---|---|---|---|---|
| repetition number in this series | 0 | memorised on | scheduled repetition | ||||
| scheduled repetition interval | last repetition or drill |
Parent (intermediate) annotation
Open itility function is to translate each basket of goods and services into a number that rank orders the baskets according to our particular consumer’s preferences. The number itself is referred to as the utility of that basket and is measured in <span>utils , which are just quantities of happiness, or well-being, or whatever comes to mind such that more of it is better than less of it.<span><body><html>
Original toplevel document
3. UTILITY THEORY: MODELING PREFERENCES AND TASTES, it is possible to come up with a rule that translates the quantities of goods in each basket into the number that our consumer has assigned to each basket. That “assignment rule” is called the utility function of that particular consumer. <span>The single task of that utility function is to translate each basket of goods and services into a number that rank orders the baskets according to our particular consumer’s preferences. The number itself is referred to as the utility of that basket and is measured in utils , which are just quantities of happiness, or well-being, or whatever comes to mind such that more of it is better than less of it. In general, we can represent the utility function as Equation (1) U=f(Qx1,Qx2,...,Qxn) where the Qs are the quantities of each of th
| status | not read | reprioritisations | ||
|---|---|---|---|---|
| last reprioritisation on | suggested re-reading day | |||
| started reading on | finished reading on |
3. UTILITY THEORY: MODELING PREFERENCES AND TASTES
ferences. The number itself is referred to as the utility of that basket and is measured in utils , which are just quantities of happiness, or well-being, or whatever comes to mind such that more of it is better than less of it. <span>In general, we can represent the utility function as Equation (1) U=f(Qx1,Qx2,...,Qxn) where the Qs are the quantities of each of the respective goods and services in the bundles. In the case of two goods—say, ounces of wine (W) and slices of bread (B)—a utility function might be simply Equation (2) U = f(W,B) = WB or the product of the number of ounces of wine and the number of slices of bread. The utility of a bundle containing 4 ounces of wine along with 2 slices of bread would equal 8 utils, and it would rank lower than a bundle containing 3 ounces of wine along with 3 slices of bread, which would yield 9 utils. The important point to note is that the utility function is just a ranking of bundles of goods. If someone were to replace all those pieces of paper with new numbers that m
Flashcard 1431565634828
| status | not learned | measured difficulty | 37% [default] | last interval [days] | |||
|---|---|---|---|---|---|---|---|
| repetition number in this series | 0 | memorised on | scheduled repetition | ||||
| scheduled repetition interval | last repetition or drill |
Parent (intermediate) annotation
Open itIn general, we can represent the utility function as Equation (1) U=f(Qx1,Qx2,...,Qxn) where the Qs are the quantities of each of the respective goods and services in the bundles. In the case of two goods—say, ounces of wine (W) and slices of bread (B)—a utility function might be simply Equation (2) U = f(W,B) = WB or the
Original toplevel document
3. UTILITY THEORY: MODELING PREFERENCES AND TASTESferences. The number itself is referred to as the utility of that basket and is measured in utils , which are just quantities of happiness, or well-being, or whatever comes to mind such that more of it is better than less of it. <span>In general, we can represent the utility function as Equation (1) U=f(Qx1,Qx2,...,Qxn) where the Qs are the quantities of each of the respective goods and services in the bundles. In the case of two goods—say, ounces of wine (W) and slices of bread (B)—a utility function might be simply Equation (2) U = f(W,B) = WB or the product of the number of ounces of wine and the number of slices of bread. The utility of a bundle containing 4 ounces of wine along with 2 slices of bread would equal 8 utils, and it would rank lower than a bundle containing 3 ounces of wine along with 3 slices of bread, which would yield 9 utils. The important point to note is that the utility function is just a ranking of bundles of goods. If someone were to replace all those pieces of paper with new numbers that m
| status | not read | reprioritisations | ||
|---|---|---|---|---|
| last reprioritisation on | suggested re-reading day | |||
| started reading on | finished reading on |
Parent (intermediate) annotation
Open itwhere the Qs are the quantities of each of the respective goods and services in the bundles. In the case of two goods—say, ounces of wine (W) and slices of bread (B)—a utility function might be simply Equation (2) <span>U = f(W,B) = WB or the product of the number of ounces of wine and the number of slices of bread. The utility of a bundle containing 4 ounces of wine along with 2 slices of bread would equal 8 utils, and it would rank lower than a bundle containing 3 ounces of wine along with 3 slices of bread, which would yield 9 utils.<span><body><html>
Original toplevel document
3. UTILITY THEORY: MODELING PREFERENCES AND TASTESferences. The number itself is referred to as the utility of that basket and is measured in utils , which are just quantities of happiness, or well-being, or whatever comes to mind such that more of it is better than less of it. <span>In general, we can represent the utility function as Equation (1) U=f(Qx1,Qx2,...,Qxn) where the Qs are the quantities of each of the respective goods and services in the bundles. In the case of two goods—say, ounces of wine (W) and slices of bread (B)—a utility function might be simply Equation (2) U = f(W,B) = WB or the product of the number of ounces of wine and the number of slices of bread. The utility of a bundle containing 4 ounces of wine along with 2 slices of bread would equal 8 utils, and it would rank lower than a bundle containing 3 ounces of wine along with 3 slices of bread, which would yield 9 utils. The important point to note is that the utility function is just a ranking of bundles of goods. If someone were to replace all those pieces of paper with new numbers that m
| status | not read | reprioritisations | ||
|---|---|---|---|---|
| last reprioritisation on | suggested re-reading day | |||
| started reading on | finished reading on |
3. UTILITY THEORY: MODELING PREFERENCES AND TASTES
ead. The utility of a bundle containing 4 ounces of wine along with 2 slices of bread would equal 8 utils, and it would rank lower than a bundle containing 3 ounces of wine along with 3 slices of bread, which would yield 9 utils. <span>The important point to note is that the utility function is just a ranking of bundles of goods. If someone were to replace all those pieces of paper with new numbers that maintained the same ranking, then the new set of numbers would be just as useful a utility function as the first in describing our consumer’s preferences. This characteristic of utility functions is called an ordinal, as contrasted to a cardinal, ranking. Ordinal rankings are weaker measures than cardinal rankings because they do not allow the calculation and ranking of the differences between bundles. 3.3. Indifference Curves: The Graphical Portrayal of the Utility Function It will be convenient for us to represent our consumer’s preferences gr
Flashcard 1431573761292
| status | not learned | measured difficulty | 37% [default] | last interval [days] | |||
|---|---|---|---|---|---|---|---|
| repetition number in this series | 0 | memorised on | scheduled repetition | ||||
| scheduled repetition interval | last repetition or drill |
Parent (intermediate) annotation
Open ites of paper with new numbers that maintained the same ranking, then the new set of numbers would be just as useful a utility function as the first in describing our consumer’s preferences. This characteristic of utility functions is called an <span>ordinal, as contrasted to a cardinal, ranking. Ordinal rankings are weaker measures than cardinal rankings because they do not allow the calculation and ranking of the differences between bundl
Original toplevel document
3. UTILITY THEORY: MODELING PREFERENCES AND TASTESead. The utility of a bundle containing 4 ounces of wine along with 2 slices of bread would equal 8 utils, and it would rank lower than a bundle containing 3 ounces of wine along with 3 slices of bread, which would yield 9 utils. <span>The important point to note is that the utility function is just a ranking of bundles of goods. If someone were to replace all those pieces of paper with new numbers that maintained the same ranking, then the new set of numbers would be just as useful a utility function as the first in describing our consumer’s preferences. This characteristic of utility functions is called an ordinal, as contrasted to a cardinal, ranking. Ordinal rankings are weaker measures than cardinal rankings because they do not allow the calculation and ranking of the differences between bundles. 3.3. Indifference Curves: The Graphical Portrayal of the Utility Function It will be convenient for us to represent our consumer’s preferences gr
Flashcard 1431576120588
| status | not learned | measured difficulty | 37% [default] | last interval [days] | |||
|---|---|---|---|---|---|---|---|
| repetition number in this series | 0 | memorised on | scheduled repetition | ||||
| scheduled repetition interval | last repetition or drill |
Parent (intermediate) annotation
Open ite same ranking, then the new set of numbers would be just as useful a utility function as the first in describing our consumer’s preferences. This characteristic of utility functions is called an ordinal, as contrasted to a cardinal, ranking. <span>Ordinal rankings are weaker measures than cardinal rankings because they do not allow the calculation and ranking of the differences between bundles.<span><body><html>
Original toplevel document
3. UTILITY THEORY: MODELING PREFERENCES AND TASTESead. The utility of a bundle containing 4 ounces of wine along with 2 slices of bread would equal 8 utils, and it would rank lower than a bundle containing 3 ounces of wine along with 3 slices of bread, which would yield 9 utils. <span>The important point to note is that the utility function is just a ranking of bundles of goods. If someone were to replace all those pieces of paper with new numbers that maintained the same ranking, then the new set of numbers would be just as useful a utility function as the first in describing our consumer’s preferences. This characteristic of utility functions is called an ordinal, as contrasted to a cardinal, ranking. Ordinal rankings are weaker measures than cardinal rankings because they do not allow the calculation and ranking of the differences between bundles. 3.3. Indifference Curves: The Graphical Portrayal of the Utility Function It will be convenient for us to represent our consumer’s preferences gr
| status | not read | reprioritisations | ||
|---|---|---|---|---|
| last reprioritisation on | suggested re-reading day | |||
| started reading on | finished reading on |
3. UTILITY THEORY: MODELING PREFERENCES AND TASTES
weaker measures than cardinal rankings because they do not allow the calculation and ranking of the differences between bundles. 3.3. Indifference Curves: The Graphical Portrayal of the Utility Function <span>It will be convenient for us to represent our consumer’s preferences graphically, not just mathematically. To that end, we introduce the concept of an indifference curve , which represents all the combinations of two goods such that the consumer is entirely indifferent among them. This is how we construct such a curve: Consider bundles that contain only two goods so that we can use a two-dimensional graph to represent them—as in Exhibit 1, where a particular bund
Flashcard 1431580314892
| status | not learned | measured difficulty | 37% [default] | last interval [days] | |||
|---|---|---|---|---|---|---|---|
| repetition number in this series | 0 | memorised on | scheduled repetition | ||||
| scheduled repetition interval | last repetition or drill |
Parent (intermediate) annotation
Open itTo represent our consumer’s preferences graphically, not just mathematically, we have the concept of an indifference curve , which represents all the combinations of two goods such that the consumer is entirely indifferent among them.
Original toplevel document
3. UTILITY THEORY: MODELING PREFERENCES AND TASTESweaker measures than cardinal rankings because they do not allow the calculation and ranking of the differences between bundles. 3.3. Indifference Curves: The Graphical Portrayal of the Utility Function <span>It will be convenient for us to represent our consumer’s preferences graphically, not just mathematically. To that end, we introduce the concept of an indifference curve , which represents all the combinations of two goods such that the consumer is entirely indifferent among them. This is how we construct such a curve: Consider bundles that contain only two goods so that we can use a two-dimensional graph to represent them—as in Exhibit 1, where a particular bund
| status | not read | reprioritisations | ||
|---|---|---|---|---|
| last reprioritisation on | suggested re-reading day | |||
| started reading on | finished reading on |
3. UTILITY THEORY: MODELING PREFERENCES AND TASTES
t our consumer’s preferences graphically, not just mathematically. To that end, we introduce the concept of an indifference curve , which represents all the combinations of two goods such that the consumer is entirely indifferent among them. <span>This is how we construct such a curve: Consider bundles that contain only two goods so that we can use a two-dimensional graph to represent them—as in Exhibit 1, where a particular bundle containing W a ounces of wine along with B a slices of bread is represented as a single point, a. The assumption of non-satiation (more is always better) ensures that all bundles lying directly above, directly to the right of, or both above and to the right (more wine and more bread
Flashcard 1431584247052
| status | not learned | measured difficulty | 37% [default] | last interval [days] | |||
|---|---|---|---|---|---|---|---|
| repetition number in this series | 0 | memorised on | scheduled repetition | ||||
| scheduled repetition interval | last repetition or drill |
Parent (intermediate) annotation
Open itThis is how we construct an indifference curve: Consider bundles that contain only two goods so that we can use a two-dimensional graph to represent them, where a particular bundle containing W a ounces of wine along with B a slices of bread is represented as a single point,
Original toplevel document
3. UTILITY THEORY: MODELING PREFERENCES AND TASTESt our consumer’s preferences graphically, not just mathematically. To that end, we introduce the concept of an indifference curve , which represents all the combinations of two goods such that the consumer is entirely indifferent among them. <span>This is how we construct such a curve: Consider bundles that contain only two goods so that we can use a two-dimensional graph to represent them—as in Exhibit 1, where a particular bundle containing W a ounces of wine along with B a slices of bread is represented as a single point, a. The assumption of non-satiation (more is always better) ensures that all bundles lying directly above, directly to the right of, or both above and to the right (more wine and more bread
| status | not read | reprioritisations | ||
|---|---|---|---|---|
| last reprioritisation on | suggested re-reading day | |||
| started reading on | finished reading on |
3. UTILITY THEORY: MODELING PREFERENCES AND TASTES
er bundles that contain only two goods so that we can use a two-dimensional graph to represent them—as in Exhibit 1, where a particular bundle containing W a ounces of wine along with B a slices of bread is represented as a single point, a. <span>The assumption of non-satiation (more is always better) ensures that all bundles lying directly above, directly to the right of, or both above and to the right (more wine and more bread) of point a must be preferred to bundle a. That set of bundles is called the “preferred-to-bundle-a” set. Correspondingly, all the bundles that lie directly below, to the left of, and both below and to the left of bundle a must
Flashcard 1431588703500
| status | not learned | measured difficulty | 37% [default] | last interval [days] | |||
|---|---|---|---|---|---|---|---|
| repetition number in this series | 0 | memorised on | scheduled repetition | ||||
| scheduled repetition interval | last repetition or drill |
Parent (intermediate) annotation
Open itThe assumption of non-satiation ensures that, in an indifference curve, all bundles lying directly above, directly to the right of, or both above and to the right of point a must be preferred to bundle a.
Original toplevel document
3. UTILITY THEORY: MODELING PREFERENCES AND TASTESer bundles that contain only two goods so that we can use a two-dimensional graph to represent them—as in Exhibit 1, where a particular bundle containing W a ounces of wine along with B a slices of bread is represented as a single point, a. <span>The assumption of non-satiation (more is always better) ensures that all bundles lying directly above, directly to the right of, or both above and to the right (more wine and more bread) of point a must be preferred to bundle a. That set of bundles is called the “preferred-to-bundle-a” set. Correspondingly, all the bundles that lie directly below, to the left of, and both below and to the left of bundle a must
| status | not read | reprioritisations | ||
|---|---|---|---|---|
| last reprioritisation on | suggested re-reading day | |||
| started reading on | finished reading on |
3. UTILITY THEORY: MODELING PREFERENCES AND TASTES
er bundles that contain only two goods so that we can use a two-dimensional graph to represent them—as in Exhibit 1, where a particular bundle containing W a ounces of wine along with B a slices of bread is represented as a single point, a. <span>The assumption of non-satiation (more is always better) ensures that all bundles lying directly above, directly to the right of, or both above and to the right (more wine and more bread) of point a must be preferred to bundle a. That set of bundles is called the “preferred-to-bundle-a” set. Correspondingly, all the bundles that lie directly below, to the left of, and both below and to the left of bundle a must yield less utility and therefore would be called the “dominated-by-bundle-a” set. Exhibit 1. Showing Preferences Graphically Note: A given bundle of two goods is represented as a single point, a, in the two-dimensional graph. Non-satiati
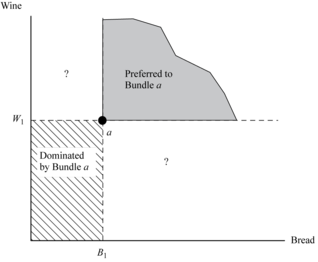
| status | not read | reprioritisations | ||
|---|---|---|---|---|
| last reprioritisation on | suggested re-reading day | |||
| started reading on | finished reading on |
Flashcard 1431599189260
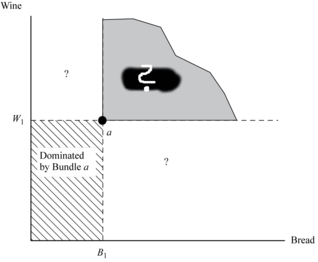
| status | not learned | measured difficulty | 37% [default] | last interval [days] | |||
|---|---|---|---|---|---|---|---|
| repetition number in this series | 0 | memorised on | scheduled repetition | ||||
| scheduled repetition interval | last repetition or drill |
| status | not read | reprioritisations | ||
|---|---|---|---|---|
| last reprioritisation on | suggested re-reading day | |||
| started reading on | finished reading on |
| status | not read | reprioritisations | ||
|---|---|---|---|---|
| last reprioritisation on | suggested re-reading day | |||
| started reading on | finished reading on |
| status | not read | reprioritisations | ||
|---|---|---|---|---|
| last reprioritisation on | suggested re-reading day | |||
| started reading on | finished reading on |
3. UTILITY THEORY: MODELING PREFERENCES AND TASTES
e directly below, to the left of, and both below and to the left of bundle a must yield less utility and therefore would be called the “dominated-by-bundle-a” set. Exhibit 1. Showing Preferences Graphically Note: <span>A given bundle of two goods is represented as a single point, a, in the two-dimensional graph. Non-satiation allows us to rank-order many, but not all, other bundles, relative to a, leaving some questions unanswered. To determine our consumer’s preferences, suppose we present a choice between bundle a and some bundle a′, which contains more bread but less wine than a. Non-satiation is n
| status | not read | reprioritisations | ||
|---|---|---|---|---|
| last reprioritisation on | suggested re-reading day | |||
| started reading on | finished reading on |
3. UTILITY THEORY: MODELING PREFERENCES AND TASTES
Note: A given bundle of two goods is represented as a single point, a, in the two-dimensional graph. Non-satiation allows us to rank-order many, but not all, other bundles, relative to a, leaving some questions unanswered. <span>To determine our consumer’s preferences, suppose we present a choice between bundle a and some bundle a′, which contains more bread but less wine than a. Non-satiation is not helpful to us in this case, so we need to ask the consumer which he prefers. If he strictly prefers a′, then we would remove a little bread and ask again. If he strictly prefers a, then we would add a little bread, and so on. Finally, after a series of adjustmen
| status | not read | reprioritisations | ||
|---|---|---|---|---|
| last reprioritisation on | suggested re-reading day | |||
| started reading on | finished reading on |
3. UTILITY THEORY: MODELING PREFERENCES AND TASTES
Note: A given bundle of two goods is represented as a single point, a, in the two-dimensional graph. Non-satiation allows us to rank-order many, but not all, other bundles, relative to a, leaving some questions unanswered. <span>To determine our consumer’s preferences, suppose we present a choice between bundle a and some bundle a′, which contains more bread but less wine than a. Non-satiation is not helpful to us in this case, so we need to ask the consumer which he prefers. If he strictly prefers a′, then we would remove a little bread and ask again. If he strictly prefers a, then we would add a little bread, and so on. Finally, after a series of adjustments, we could find just the right combination of bread and wine such that the new bundle a′ would be equally satisfying to our consumer as bundle a. That is to say, our consumer would be indifferent between consuming bundle a or bundle a′. We would then choose a bundle, say a′′, that contains more wine and less bread than bundle a, and we would again adjust the goods such that the consumer is once again indifferent betwee
| status | not read | reprioritisations | ||
|---|---|---|---|---|
| last reprioritisation on | suggested re-reading day | |||
| started reading on | finished reading on |
3. UTILITY THEORY: MODELING PREFERENCES AND TASTES
Note: A given bundle of two goods is represented as a single point, a, in the two-dimensional graph. Non-satiation allows us to rank-order many, but not all, other bundles, relative to a, leaving some questions unanswered. <span>To determine our consumer’s preferences, suppose we present a choice between bundle a and some bundle a′, which contains more bread but less wine than a. Non-satiation is not helpful to us in this case, so we need to ask the consumer which he prefers. If he strictly prefers a′, then we would remove a little bread and ask again. If he strictly prefers a, then we would add a little bread, and so on. Finally, after a series of adjustments, we could find just the right combination of bread and wine such that the new bundle a′ would be equally satisfying to our consumer as bundle a. That is to say, our consumer would be indifferent between consuming bundle a or bundle a′. We would then choose a bundle, say a′′, that contains more wine and less bread than bundle a, and we would again adjust the goods such that the consumer is once again indifferent between bundle a and bundle a′′. By continuing to choose bundles and make adjustments, it would be possible to identify all possible bundles such that the consumer is just indifferent among each of them and bundle a. Such a set of points is represented in Exhibit 2, where the indifference curve through point a represents that set of bundles. Notice that the “preferred-to-bundle-a” set has expanded to include all bundles that lie in the region above and to the right of the indifference curve. Correspondingly, the “dominated-by-bundle-a” set has expanded to include all bundles that lie in the region below and to the left of the indifference curve. Exhibit 2. An Indifference Curve Note: An indifference curve shows all combinations of two goods such that the consumer is indifferent between them.
| status | not read | reprioritisations | ||
|---|---|---|---|---|
| last reprioritisation on | suggested re-reading day | |||
| started reading on | finished reading on |
| status | not read | reprioritisations | ||
|---|---|---|---|---|
| last reprioritisation on | suggested re-reading day | |||
| started reading on | finished reading on |
| status | not read | reprioritisations | ||
|---|---|---|---|---|
| last reprioritisation on | suggested re-reading day | |||
| started reading on | finished reading on |
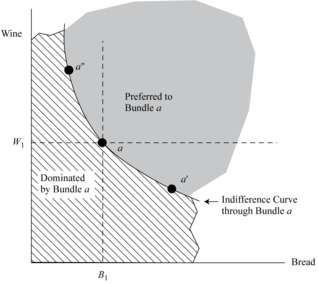
| status | not read | reprioritisations | ||
|---|---|---|---|---|
| last reprioritisation on | suggested re-reading day | |||
| started reading on | finished reading on |
| status | not read | reprioritisations | ||
|---|---|---|---|---|
| last reprioritisation on | suggested re-reading day | |||
| started reading on | finished reading on |
3. UTILITY THEORY: MODELING PREFERENCES AND TASTES
ifference curve. Correspondingly, the “dominated-by-bundle-a” set has expanded to include all bundles that lie in the region below and to the left of the indifference curve. Exhibit 2. An Indifference Curve Note: <span>An indifference curve shows all combinations of two goods such that the consumer is indifferent between them. The indifference curve represents our consumer’s unique preferences over the two goods wine and bread. Its negative slope simply represents that both wine and bread are se
| status | not read | reprioritisations | ||
|---|---|---|---|---|
| last reprioritisation on | suggested re-reading day | |||
| started reading on | finished reading on |
| status | not read | reprioritisations | ||
|---|---|---|---|---|
| last reprioritisation on | suggested re-reading day | |||
| started reading on | finished reading on |
| status | not read | reprioritisations | ||
|---|---|---|---|---|
| last reprioritisation on | suggested re-reading day | |||
| started reading on | finished reading on |
| status | not read | reprioritisations | ||
|---|---|---|---|---|
| last reprioritisation on | suggested re-reading day | |||
| started reading on | finished reading on |
| status | not read | reprioritisations | ||
|---|---|---|---|---|
| last reprioritisation on | suggested re-reading day | |||
| started reading on | finished reading on |
| status | not read | reprioritisations | ||
|---|---|---|---|---|
| last reprioritisation on | suggested re-reading day | |||
| started reading on | finished reading on |
| status | not read | reprioritisations | ||
|---|---|---|---|---|
| last reprioritisation on | suggested re-reading day | |||
| started reading on | finished reading on |
| status | not read | reprioritisations | ||
|---|---|---|---|---|
| last reprioritisation on | suggested re-reading day | |||
| started reading on | finished reading on |
| status | not read | reprioritisations | ||
|---|---|---|---|---|
| last reprioritisation on | suggested re-reading day | |||
| started reading on | finished reading on |
| status | not read | reprioritisations | ||
|---|---|---|---|---|
| last reprioritisation on | suggested re-reading day | |||
| started reading on | finished reading on |
3. UTILITY THEORY: MODELING PREFERENCES AND TASTES
n below and to the left of the indifference curve. Exhibit 2. An Indifference Curve Note: An indifference curve shows all combinations of two goods such that the consumer is indifferent between them. <span>The indifference curve represents our consumer’s unique preferences over the two goods wine and bread. Its negative slope simply represents that both wine and bread are seen as “good” to this consumer; in order to maintain indifference, a decrease in the quantity of wine must be compensated for by an increase in the quantity of bread. Its curvature tells us something about the strength of his willingness to trade off one good for the other. The indifference curve in Exhibit 2 is characteristically drawn to be convex
Flashcard 1431633530124
| status | not learned | measured difficulty | 37% [default] | last interval [days] | |||
|---|---|---|---|---|---|---|---|
| repetition number in this series | 0 | memorised on | scheduled repetition | ||||
| scheduled repetition interval | last repetition or drill |
Parent (intermediate) annotation
Open itpan>The indifference curve represents our consumer’s unique preferences over the two goods wine and bread. Its negative slope simply represents that both wine and bread are seen as “good” to this consumer; in order to maintain indifference, a <span>decrease in the quantity of wine must be compensated for by an increase in the quantity of bread.<span><body><html>
Original toplevel document
3. UTILITY THEORY: MODELING PREFERENCES AND TASTESn below and to the left of the indifference curve. Exhibit 2. An Indifference Curve Note: An indifference curve shows all combinations of two goods such that the consumer is indifferent between them. <span>The indifference curve represents our consumer’s unique preferences over the two goods wine and bread. Its negative slope simply represents that both wine and bread are seen as “good” to this consumer; in order to maintain indifference, a decrease in the quantity of wine must be compensated for by an increase in the quantity of bread. Its curvature tells us something about the strength of his willingness to trade off one good for the other. The indifference curve in Exhibit 2 is characteristically drawn to be convex
| status | not read | reprioritisations | ||
|---|---|---|---|---|
| last reprioritisation on | suggested re-reading day | |||
| started reading on | finished reading on |
3. UTILITY THEORY: MODELING PREFERENCES AND TASTES
d bread. Its negative slope simply represents that both wine and bread are seen as “good” to this consumer; in order to maintain indifference, a decrease in the quantity of wine must be compensated for by an increase in the quantity of bread. <span>Its curvature tells us something about the strength of his willingness to trade off one good for the other. The indifference curve in Exhibit 2 is characteristically drawn to be convex when viewed from the origin. This indicates that the willingness to give up wine to obtain a little more bread diminishes the more bread and the less wine the bundle contains. We capture this willingness to give up one good to obtain a little more of the other in the phrase marginal rate of substitution of bread for wine, MRS BW . The MRS BW i
Flashcard 1431638510860
| status | not learned | measured difficulty | 37% [default] | last interval [days] | |||
|---|---|---|---|---|---|---|---|
| repetition number in this series | 0 | memorised on | scheduled repetition | ||||
| scheduled repetition interval | last repetition or drill |
Parent (intermediate) annotation
Open itIts curvature tells us something about the strength of his willingness to trade off one good for the other. The indifference curve is drawn to be convex when viewed from the origin. This indicates that the willingness to give up wine to obtain a little more bread diminishes the more bread and the less wine the bundle contains.
Original toplevel document
3. UTILITY THEORY: MODELING PREFERENCES AND TASTESd bread. Its negative slope simply represents that both wine and bread are seen as “good” to this consumer; in order to maintain indifference, a decrease in the quantity of wine must be compensated for by an increase in the quantity of bread. <span>Its curvature tells us something about the strength of his willingness to trade off one good for the other. The indifference curve in Exhibit 2 is characteristically drawn to be convex when viewed from the origin. This indicates that the willingness to give up wine to obtain a little more bread diminishes the more bread and the less wine the bundle contains. We capture this willingness to give up one good to obtain a little more of the other in the phrase marginal rate of substitution of bread for wine, MRS BW . The MRS BW i
| status | not read | reprioritisations | ||
|---|---|---|---|---|
| last reprioritisation on | suggested re-reading day | |||
| started reading on | finished reading on |
3. UTILITY THEORY: MODELING PREFERENCES AND TASTES
in Exhibit 2 is characteristically drawn to be convex when viewed from the origin. This indicates that the willingness to give up wine to obtain a little more bread diminishes the more bread and the less wine the bundle contains. <span>We capture this willingness to give up one good to obtain a little more of the other in the phrase marginal rate of substitution of bread for wine, MRS BW . The MRS BW is the rate at which the consumer is willing to give up wine to obtain a small increment of bread, holding utility constant (i.e., movement along an indifference curve). Notice that the convexity implies that at a bundle like a′′, which contains rather a lot of wine and not much bread, the consumer would be willing to give up a considerable amount of wi
Flashcard 1431643229452
| status | not learned | measured difficulty | 37% [default] | last interval [days] | |||
|---|---|---|---|---|---|---|---|
| repetition number in this series | 0 | memorised on | scheduled repetition | ||||
| scheduled repetition interval | last repetition or drill |
Parent (intermediate) annotation
Open itWe capture this willingness to give up one good to obtain a little more of the other in the phrase marginal rate of substitution of bread for wine, MRS BW . The MRS BW is the rate at which the consumer is willing to give up wine to obtain a small increment of bread, holding utility constant (i.e., movement along
Original toplevel document
3. UTILITY THEORY: MODELING PREFERENCES AND TASTESin Exhibit 2 is characteristically drawn to be convex when viewed from the origin. This indicates that the willingness to give up wine to obtain a little more bread diminishes the more bread and the less wine the bundle contains. <span>We capture this willingness to give up one good to obtain a little more of the other in the phrase marginal rate of substitution of bread for wine, MRS BW . The MRS BW is the rate at which the consumer is willing to give up wine to obtain a small increment of bread, holding utility constant (i.e., movement along an indifference curve). Notice that the convexity implies that at a bundle like a′′, which contains rather a lot of wine and not much bread, the consumer would be willing to give up a considerable amount of wi
| status | not read | reprioritisations | ||
|---|---|---|---|---|
| last reprioritisation on | suggested re-reading day | |||
| started reading on | finished reading on |
Parent (intermediate) annotation
Open itWe capture this willingness to give up one good to obtain a little more of the other in the phrase marginal rate of substitution of bread for wine, MRS BW . The MRS BW is the rate at which the consumer is willing to give up wine to obtain a small increment of bread, holding utility constant (i.e., movement along an indifference curve).
Original toplevel document
3. UTILITY THEORY: MODELING PREFERENCES AND TASTESin Exhibit 2 is characteristically drawn to be convex when viewed from the origin. This indicates that the willingness to give up wine to obtain a little more bread diminishes the more bread and the less wine the bundle contains. <span>We capture this willingness to give up one good to obtain a little more of the other in the phrase marginal rate of substitution of bread for wine, MRS BW . The MRS BW is the rate at which the consumer is willing to give up wine to obtain a small increment of bread, holding utility constant (i.e., movement along an indifference curve). Notice that the convexity implies that at a bundle like a′′, which contains rather a lot of wine and not much bread, the consumer would be willing to give up a considerable amount of wi
| status | not read | reprioritisations | ||
|---|---|---|---|---|
| last reprioritisation on | suggested re-reading day | |||
| started reading on | finished reading on |
| status | not read | reprioritisations | ||
|---|---|---|---|---|
| last reprioritisation on | suggested re-reading day | |||
| started reading on | finished reading on |
3. UTILITY THEORY: MODELING PREFERENCES AND TASTES
ence curve is quite steep at that point.) However, at a point like a′, which contains considerably more bread but less wine than a′′, the consumer is not ready to sacrifice nearly as much wine to obtain a little more bread. This suggests that <span>the value being placed on bread, in terms of the amount of wine the consumer is willing to give up for bread, diminishes the more bread and less wine he has. It follows that the MRS BW is the negative of the slope of the tangent to the indifference curve at any given bundle. If, at some point, the slope of the indifference curve had value –
| status | not read | reprioritisations | ||
|---|---|---|---|---|
| last reprioritisation on | suggested re-reading day | |||
| started reading on | finished reading on |
3. UTILITY THEORY: MODELING PREFERENCES AND TASTES
early as much wine to obtain a little more bread. This suggests that the value being placed on bread, in terms of the amount of wine the consumer is willing to give up for bread, diminishes the more bread and less wine he has. It follows that <span>the MRS BW is the negative of the slope of the tangent to the indifference curve at any given bundle. If, at some point, the slope of the indifference curve had value –2.5, it means that, starting at that particular bundle, our consumer would be willing to sacrifice wine to obtain bread at the rate of 2.5 ounces of wine per slice of bread. Because of the convexity assumption—that MRS BW must diminish as he moves toward more bread and less wine—the MRS BW is continuously changing as he moves along his indifference curve.
Flashcard 1431655550220
| status | not learned | measured difficulty | 37% [default] | last interval [days] | |||
|---|---|---|---|---|---|---|---|
| repetition number in this series | 0 | memorised on | scheduled repetition | ||||
| scheduled repetition interval | last repetition or drill |
Parent (intermediate) annotation
Open itthe MRS BW is the negative of the slope of the tangent to the indifference curve at any given bundle. If, at some point, the slope of the indifference curve had value –2.5, it means that, starting at that particular bundle, our consumer would be willing to sacrifice wine to obtain bread at the rate of 2.5 ounces of wine per slice of bread.
Original toplevel document
3. UTILITY THEORY: MODELING PREFERENCES AND TASTESearly as much wine to obtain a little more bread. This suggests that the value being placed on bread, in terms of the amount of wine the consumer is willing to give up for bread, diminishes the more bread and less wine he has. It follows that <span>the MRS BW is the negative of the slope of the tangent to the indifference curve at any given bundle. If, at some point, the slope of the indifference curve had value –2.5, it means that, starting at that particular bundle, our consumer would be willing to sacrifice wine to obtain bread at the rate of 2.5 ounces of wine per slice of bread. Because of the convexity assumption—that MRS BW must diminish as he moves toward more bread and less wine—the MRS BW is continuously changing as he moves along his indifference curve.
| status | not read | reprioritisations | ||
|---|---|---|---|---|
| last reprioritisation on | suggested re-reading day | |||
| started reading on | finished reading on |
3. UTILITY THEORY: MODELING PREFERENCES AND TASTES
e. If, at some point, the slope of the indifference curve had value –2.5, it means that, starting at that particular bundle, our consumer would be willing to sacrifice wine to obtain bread at the rate of 2.5 ounces of wine per slice of bread. <span>Because of the convexity assumption—that MRS BW must diminish as he moves toward more bread and less wine—the MRS BW is continuously changing as he moves along his indifference curve. EXAMPLE 2 Understanding the Marginal Rate of Substitution Tom Warren currently has 50 blueberries and 20 peanuts. His marginal rate of substitution
| status | not read | reprioritisations | ||
|---|---|---|---|---|
| last reprioritisation on | suggested re-reading day | |||
| started reading on | finished reading on |
3. UTILITY THEORY: MODELING PREFERENCES AND TASTES
t MRS BW must diminish as he moves toward more bread and less wine—the MRS BW is continuously changing as he moves along his indifference curve. EXAMPLE 2 Understanding the Marginal Rate of Substitution <span>Tom Warren currently has 50 blueberries and 20 peanuts. His marginal rate of substitution of peanuts for blueberries, MRS pb equals 4, and his indifference curves are strictly convex. Determine whether Warren would be willing to trade at the rate of 3 of his blueberries in exchange for 1 more peanut. Suppose that Warren is indifferent between his current bundle and one containing 40 blueberries and 25 peanuts. Describe Warren’s MRS pb evaluated at the new bundle. &#
Flashcard 1431662628108
| status | not learned | measured difficulty | 37% [default] | last interval [days] | |||
|---|---|---|---|---|---|---|---|
| repetition number in this series | 0 | memorised on | scheduled repetition | ||||
| scheduled repetition interval | last repetition or drill |
Parent (intermediate) annotation
Open itf peanuts for blueberries, MRS pb equals 4, and his indifference curves are strictly convex. Determine whether Warren would be willing to trade at the rate of 3 of his blueberries in exchange for 1 more peanut. <span>Solution MRS pb = 4 means that Warren would be willing to give up 4 blueberries for 1 peanut, at that point. He clearly would be willing to give up blueberries at a rate less than that, namely, 3-to-1. <span><body><html>
Original toplevel document
3. UTILITY THEORY: MODELING PREFERENCES AND TASTESt MRS BW must diminish as he moves toward more bread and less wine—the MRS BW is continuously changing as he moves along his indifference curve. EXAMPLE 2 Understanding the Marginal Rate of Substitution <span>Tom Warren currently has 50 blueberries and 20 peanuts. His marginal rate of substitution of peanuts for blueberries, MRS pb equals 4, and his indifference curves are strictly convex. Determine whether Warren would be willing to trade at the rate of 3 of his blueberries in exchange for 1 more peanut. Suppose that Warren is indifferent between his current bundle and one containing 40 blueberries and 25 peanuts. Describe Warren’s MRS pb evaluated at the new bundle. &#
| status | not read | reprioritisations | ||
|---|---|---|---|---|
| last reprioritisation on | suggested re-reading day | |||
| started reading on | finished reading on |
3. UTILITY THEORY: MODELING PREFERENCES AND TASTES
t MRS BW must diminish as he moves toward more bread and less wine—the MRS BW is continuously changing as he moves along his indifference curve. EXAMPLE 2 Understanding the Marginal Rate of Substitution <span>Tom Warren currently has 50 blueberries and 20 peanuts. His marginal rate of substitution of peanuts for blueberries, MRS pb equals 4, and his indifference curves are strictly convex. Determine whether Warren would be willing to trade at the rate of 3 of his blueberries in exchange for 1 more peanut. Suppose that Warren is indifferent between his current bundle and one containing 40 blueberries and 25 peanuts. Describe Warren’s MRS pb evaluated at the new bundle. Solution to 1: MRS pb = 4 means that Warren would be willing to give up 4 blueberries for 1 peanut, at that point. He clearly would be willing to give up blueberries at a rate less than that, namely, 3-to-1. Solution to 2: The new bundle has more peanuts and fewer blueberries than the original one, and Warren is indifferent between the two, meaning that both bundles lie on the same indifference curve, where blueberries are plotted on the vertical axis and peanuts on the horizontal axis. Because his indifference curves are strictly convex and the new bundle lies below and to the right of his old bundle, his MRS pb must be less than 4. That is to say, his indifference curve at the new point must be less steep than at the original bundle. 3.4. Indifference Curve Maps There was nothing special about our initial choice of bundle a as a starting point for the indifferenc
| status | not read | reprioritisations | ||
|---|---|---|---|---|
| last reprioritisation on | suggested re-reading day | |||
| started reading on | finished reading on |
| status | not read | reprioritisations | ||
|---|---|---|---|---|
| last reprioritisation on | suggested re-reading day | |||
| started reading on | finished reading on |
Flashcard 1431671541004
| status | not learned | measured difficulty | 37% [default] | last interval [days] | |||
|---|---|---|---|---|---|---|---|
| repetition number in this series | 0 | memorised on | scheduled repetition | ||||
| scheduled repetition interval | last repetition or drill |
Parent (intermediate) annotation
Open itCo to jest ciepło ? Ciepło jest to forma wewnętrznej energii substancji.
Original toplevel document (pdf)
cannot see any pdfs| status | not read | reprioritisations | ||
|---|---|---|---|---|
| last reprioritisation on | suggested re-reading day | |||
| started reading on | finished reading on |
3. UTILITY THEORY: MODELING PREFERENCES AND TASTES
ght of his old bundle, his MRS pb must be less than 4. That is to say, his indifference curve at the new point must be less steep than at the original bundle. 3.4. Indifference Curve Maps <span>There was nothing special about our initial choice of bundle a as a starting point for the indifference curve. We could have begun with a bundle containing more of both goods. In that case, we could have gone through the same process of trial and error, and we would have ended up with another indifference curve, this one passing through the new point and lying above and to the right of the first one. Indeed, we could construct any number of indifference curves in the same manner simply by starting at a different initial bundle. The result is an entire family of indifference curves,
| status | not read | reprioritisations | ||
|---|---|---|---|---|
| last reprioritisation on | suggested re-reading day | |||
| started reading on | finished reading on |
3. UTILITY THEORY: MODELING PREFERENCES AND TASTES
goods. In that case, we could have gone through the same process of trial and error, and we would have ended up with another indifference curve, this one passing through the new point and lying above and to the right of the first one. Indeed, <span>we could construct any number of indifference curves in the same manner simply by starting at a different initial bundle. The result is an entire family of indifference curves, called an indifference curve map , and it represents our consumer’s entire utility function. The word map is appropriate because the entire set of indifference curves comprises a contour map of this consumer’s utility fu
Flashcard 1431680191756
| status | not learned | measured difficulty | 37% [default] | last interval [days] | |||
|---|---|---|---|---|---|---|---|
| repetition number in this series | 0 | memorised on | scheduled repetition | ||||
| scheduled repetition interval | last repetition or drill |
Parent (intermediate) annotation
Open itbody>we could construct any number of indifference curves in the same manner we made the first indifference curve, simply by starting at a different initial bundle. The result is an entire family of indifference curves, called an indifference curve map ,<body><html>
Original toplevel document
3. UTILITY THEORY: MODELING PREFERENCES AND TASTESgoods. In that case, we could have gone through the same process of trial and error, and we would have ended up with another indifference curve, this one passing through the new point and lying above and to the right of the first one. Indeed, <span>we could construct any number of indifference curves in the same manner simply by starting at a different initial bundle. The result is an entire family of indifference curves, called an indifference curve map , and it represents our consumer’s entire utility function. The word map is appropriate because the entire set of indifference curves comprises a contour map of this consumer’s utility fu
| status | not read | reprioritisations | ||
|---|---|---|---|---|
| last reprioritisation on | suggested re-reading day | |||
| started reading on | finished reading on |
3. UTILITY THEORY: MODELING PREFERENCES AND TASTES
and lying above and to the right of the first one. Indeed, we could construct any number of indifference curves in the same manner simply by starting at a different initial bundle. The result is an entire family of indifference curves, called <span>an indifference curve map , and it represents our consumer’s entire utility function. The word map is appropriate because the entire set of indifference curves comprises a contour map of this consumer’s utility function. Each contour, or indifference curve, is a set of p

| status | not read | reprioritisations | ||
|---|---|---|---|---|
| last reprioritisation on | suggested re-reading day | |||
| started reading on | finished reading on |
Flashcard 1431688842508

| status | not learned | measured difficulty | 37% [default] | last interval [days] | |||
|---|---|---|---|---|---|---|---|
| repetition number in this series | 0 | memorised on | scheduled repetition | ||||
| scheduled repetition interval | last repetition or drill |
| status | not read | reprioritisations | ||
|---|---|---|---|---|
| last reprioritisation on | suggested re-reading day | |||
| started reading on | finished reading on |
3. UTILITY THEORY: MODELING PREFERENCES AND TASTES
m one indifference curve to the next represents an increase in utility, and moving down and to the left represents a decrease. The map could look like that in Exhibit 3. Exhibit 3. An Indifference Curve Map Note: <span>The indifference curve map represents the consumer’s utility function. Any curve above and to the right represents a higher level of utility. Because of the completeness assumption, there will be one indifference curve passing through every point in the set. Because of the transitivity assumption, no two indiffer
| status | not read | reprioritisations | ||
|---|---|---|---|---|
| last reprioritisation on | suggested re-reading day | |||
| started reading on | finished reading on |
3. UTILITY THEORY: MODELING PREFERENCES AND TASTES
in Exhibit 3. Exhibit 3. An Indifference Curve Map Note: The indifference curve map represents the consumer’s utility function. Any curve above and to the right represents a higher level of utility. <span>Because of the completeness assumption, there will be one indifference curve passing through every point in the set. Because of the transitivity assumption, no two indifference curves for a given consumer can ever cross. Exhibit 4 shows why. If bundle a and bundle b lie on the same indifference curve,
| status | not read | reprioritisations | ||
|---|---|---|---|---|
| last reprioritisation on | suggested re-reading day | |||
| started reading on | finished reading on |
3. UTILITY THEORY: MODELING PREFERENCES AND TASTES
presents the consumer’s utility function. Any curve above and to the right represents a higher level of utility. Because of the completeness assumption, there will be one indifference curve passing through every point in the set. <span>Because of the transitivity assumption, no two indifference curves for a given consumer can ever cross. Exhibit 4 shows why. If bundle a and bundle b lie on the same indifference curve, the consumer must be indifferent between the two. If a and c lie on the same indifference curve, she mu
Flashcard 1431699066124
| status | not learned | measured difficulty | 37% [default] | last interval [days] | |||
|---|---|---|---|---|---|---|---|
| repetition number in this series | 0 | memorised on | scheduled repetition | ||||
| scheduled repetition interval | last repetition or drill |
Parent (intermediate) annotation
Open itBecause of the transitivity assumption, no two indifference curves for a given consumer can ever cross.
Original toplevel document
3. UTILITY THEORY: MODELING PREFERENCES AND TASTESpresents the consumer’s utility function. Any curve above and to the right represents a higher level of utility. Because of the completeness assumption, there will be one indifference curve passing through every point in the set. <span>Because of the transitivity assumption, no two indifference curves for a given consumer can ever cross. Exhibit 4 shows why. If bundle a and bundle b lie on the same indifference curve, the consumer must be indifferent between the two. If a and c lie on the same indifference curve, she mu

| status | not read | reprioritisations | ||
|---|---|---|---|---|
| last reprioritisation on | suggested re-reading day | |||
| started reading on | finished reading on |
| status | not read | reprioritisations | ||
|---|---|---|---|---|
| last reprioritisation on | suggested re-reading day | |||
| started reading on | finished reading on |
Indifference curves cannot touch
he same indifference curve, she must be indifferent between these two bundles as well. But because bundle c contains more of both wine and bread than bundle b, she must prefer c to b, which violates transitivity of preferences. So we see that <span>indifference curves will generally be strictly convex and negatively sloped, and they cannot cross. These are the only restrictions we place on indifference curve maps.<span><body><html>
| status | not read | reprioritisations | ||
|---|---|---|---|---|
| last reprioritisation on | suggested re-reading day | |||
| started reading on | finished reading on |
3. UTILITY THEORY: MODELING PREFERENCES AND TASTES
l generally be strictly convex and negatively sloped, and they cannot cross. These are the only restrictions we place on indifference curve maps. Exhibit 4. Why One Person’s Indifference Curves Cannot Cross Note: <span>Two indifference curves for a given individual cannot cross because the transitivity assumption would be violated. 3.5. Gains from Voluntary Exchange: Creating Wealth through Trade There is no requirement that all consumers have the same preferences. Take the
| status | not read | reprioritisations | ||
|---|---|---|---|---|
| last reprioritisation on | suggested re-reading day | |||
| started reading on | finished reading on |
Flashcard 1431707454732
| status | not learned | measured difficulty | 37% [default] | last interval [days] | |||
|---|---|---|---|---|---|---|---|
| repetition number in this series | 0 | memorised on | scheduled repetition | ||||
| scheduled repetition interval | last repetition or drill |
Section 3. UTILITY THEORY: MODELING PREFERENCES AND TASTES
3. UTILITY THEORY: MODELING PREFERENCES AND TASTES The section is divided in: 3.1. Axioms of the Theory of Consumer Choice 3.2. Representing the Preference of a Consumer: The Utility Function 3.3. Indifference Curves: The Graphical Portrayal of the Utility Function 3.4. In
| status | not read | reprioritisations | ||
|---|---|---|---|---|
| last reprioritisation on | suggested re-reading day | |||
| started reading on | finished reading on |
3. UTILITY THEORY: MODELING PREFERENCES AND TASTES
3; Note: Two indifference curves for a given individual cannot cross because the transitivity assumption would be violated. 3.5. Gains from Voluntary Exchange: Creating Wealth through Trade <span>There is no requirement that all consumers have the same preferences. Take the case of Helen Smith and Tom Warren. The indifference curves for Smith will likely be different from Warren’s. And although for any given individual two indifference curves cannot cross, there is no reason why two indifference curves for two different consumers cannot intersect. Consider Exhibit 5, in which we observe an indifference curve for Smith and one for Warren. Suppose they are initially endowed with identical bundles, represented by a. They each have e
Flashcard 1431715056908
| status | not learned | measured difficulty | 37% [default] | last interval [days] | |||
|---|---|---|---|---|---|---|---|
| repetition number in this series | 0 | memorised on | scheduled repetition | ||||
| scheduled repetition interval | last repetition or drill |
Parent (intermediate) annotation
Open itelen and Tom. The indifference curves for Helen will likely be different from Tom’s. And although for any given individual two indifference curves cannot cross, there is no reason why two indifference curves for two different consumers cannot <span>intersect.<span><body><html>
Original toplevel document
3. UTILITY THEORY: MODELING PREFERENCES AND TASTES3; Note: Two indifference curves for a given individual cannot cross because the transitivity assumption would be violated. 3.5. Gains from Voluntary Exchange: Creating Wealth through Trade <span>There is no requirement that all consumers have the same preferences. Take the case of Helen Smith and Tom Warren. The indifference curves for Smith will likely be different from Warren’s. And although for any given individual two indifference curves cannot cross, there is no reason why two indifference curves for two different consumers cannot intersect. Consider Exhibit 5, in which we observe an indifference curve for Smith and one for Warren. Suppose they are initially endowed with identical bundles, represented by a. They each have e

| status | not read | reprioritisations | ||
|---|---|---|---|---|
| last reprioritisation on | suggested re-reading day | |||
| started reading on | finished reading on |
| status | not read | reprioritisations | ||
|---|---|---|---|---|
| last reprioritisation on | suggested re-reading day | |||
| started reading on | finished reading on |
3. UTILITY THEORY: MODELING PREFERENCES AND TASTES
observe that Warren has a relatively stronger preference for bread compared to Smith, and Smith has a relatively stronger preference for wine than Warren. Exhibit 5. Two Consumers with Different Preferences Note: <span>When two consumers have different preferences, they will have different marginal rates of substitution when evaluated at identical bundles. Here, Warren has a relatively strong preference for bread because he is willing to give up more wine for another slice of bread than is Smith. Suppose that the slope of Warren’s indifference curve at point a is equal to −2, and the slope of Smith’s indifference curve at point a is equal to – 12 . Warren is willing
| status | not read | reprioritisations | ||
|---|---|---|---|---|
| last reprioritisation on | suggested re-reading day | |||
| started reading on | finished reading on |
| status | not read | reprioritisations | ||
|---|---|---|---|---|
| last reprioritisation on | suggested re-reading day | |||
| started reading on | finished reading on |
3. UTILITY THEORY: MODELING PREFERENCES AND TASTES
e ounce of wine. If they actually made such a trade at the one-to-one ratio, then Smith would end up with more wine and less bread than she started with, and Warren would end up with more bread and less wine than he started with. <span>We could say that Warren is better off by the value to him of one ounce of wine because he was willing to give up two ounces but only had to give up one ounce for his slice of bread. What about Smith? She is better off by the value to her of one slice of bread because she was willing to give up two slices of bread for her one additional ounce of wine but only had to give up one slice. Both Smith and Warren are better off after they trade. There is no more bread or wine than when they began, but there is greater wealth because both are better off than before they traded with each other. Both Smith and Warren ended on higher indifference curves than when they began. As Smith gives up slices of bread for more ounces of wine, her MRS BW increases; her indifference curve becomes steeper. Simultaneously, as Warren gives up ounces of wine
| status | not read | reprioritisations | ||
|---|---|---|---|---|
| last reprioritisation on | suggested re-reading day | |||
| started reading on | finished reading on |
Flashcard 1431730785548
| status | not learned | measured difficulty | 37% [default] | last interval [days] | |||
|---|---|---|---|---|---|---|---|
| repetition number in this series | 0 | memorised on | scheduled repetition | ||||
| scheduled repetition interval | last repetition or drill |
Open it
Note that because their indifference curves intersect at that point, their slopes are different.
| status | not read | reprioritisations | ||
|---|---|---|---|---|
| last reprioritisation on | suggested re-reading day | |||
| started reading on | finished reading on |
Flashcard 1431735766284
| status | not learned | measured difficulty | 37% [default] | last interval [days] | |||
|---|---|---|---|---|---|---|---|
| repetition number in this series | 0 | memorised on | scheduled repetition | ||||
| scheduled repetition interval | last repetition or drill |
Open it
Warren’s indifference curve is steeper at point a than is Smith’s. This means that Warren’s MRS BW is greater than Smith’s MRS BW .
Flashcard 1431743368460
| status | not learned | measured difficulty | 37% [default] | last interval [days] | |||
|---|---|---|---|---|---|---|---|
| repetition number in this series | 0 | memorised on | scheduled repetition | ||||
| scheduled repetition interval | last repetition or drill |
| status | not read | reprioritisations | ||
|---|---|---|---|---|
| last reprioritisation on | suggested re-reading day | |||
| started reading on | finished reading on |
Flashcard 1431754902796
| status | not learned | measured difficulty | 37% [default] | last interval [days] | |||
|---|---|---|---|---|---|---|---|
| repetition number in this series | 0 | memorised on | scheduled repetition | ||||
| scheduled repetition interval | last repetition or drill |
Parent (intermediate) annotation
Open itRhetoric is the master art of the trivium, 12 for it presupposes and makes use of grammar and logic; it is the art of communicating through symbols ideas about reality</htm
Original toplevel document (pdf)
cannot see any pdfsFlashcard 1431756737804
| status | not learned | measured difficulty | 37% [default] | last interval [days] | |||
|---|---|---|---|---|---|---|---|
| repetition number in this series | 0 | memorised on | scheduled repetition | ||||
| scheduled repetition interval | last repetition or drill |
Parent (intermediate) annotation
Open itRhetoric is the master art of the trivium, 12 for it presupposes and makes use of grammar and logic; it is the art of communicating through symbols ideas about reality</htm
Original toplevel document (pdf)
cannot see any pdfsFlashcard 1431761980684
| status | not learned | measured difficulty | 37% [default] | last interval [days] | |||
|---|---|---|---|---|---|---|---|
| repetition number in this series | 0 | memorised on | scheduled repetition | ||||
| scheduled repetition interval | last repetition or drill |
Parent (intermediate) annotation
Open ithumans alone among animals have the power to think. Consequently, they alone have language in the proper sense of the word. 1 This follows from their nature, for they are rational and therefore have something to say, social and therefore have someone to say it to, and animal and therefore require a physical mode of communicating ideas from one mind, which
Original toplevel document (pdf)
cannot see any pdfsFlashcard 1431767223564
| status | not learned | measured difficulty | 37% [default] | last interval [days] | |||
|---|---|---|---|---|---|---|---|
| repetition number in this series | 0 | memorised on | scheduled repetition | ||||
| scheduled repetition interval | last repetition or drill |
Parent (intermediate) annotation
Open itThese arts of reading, writing, and reckoning have formed the traditional basis of liberal education, each constituting both a field of knowledge and the technique t o acquire that knowledge.
Original toplevel document (pdf)
cannot see any pdfsFlashcard 1431771417868
| status | not learned | measured difficulty | 37% [default] | last interval [days] | |||
|---|---|---|---|---|---|---|---|
| repetition number in this series | 0 | memorised on | scheduled repetition | ||||
| scheduled repetition interval | last repetition or drill |
Parent (intermediate) annotation
Open itle experience a rise in income, they buy absolutely less of some goods, and they buy more when their income falls. Hence, income elasticity of demand for those goods is negative. By definition, goods with negative income elasticity are called <span>inferior goods .<span><body><html>
Original toplevel document
4.3. Income Elasticity of Demand: Normal and Inferior Goodsthat the demand for that particular good rises when income increases and falls when income decreases. Hence, if we find that when income rises, people buy more meals at restaurants, then dining out is defined to be a normal good. <span>For some goods, there is an inverse relationship between quantity demanded and consumer income. That is, when people experience a rise in income, they buy absolutely less of some goods, and they buy more when their income falls. Hence, income elasticity of demand for those goods is negative. By definition, goods with negative income elasticity are called inferior goods . Again, the word inferior means nothing other than that the income elasticity of demand for that good is observed to be negative. It does not necessarily indicate anything at all about t
| status | not read | reprioritisations | ||
|---|---|---|---|---|
| last reprioritisation on | suggested re-reading day | |||
| started reading on | finished reading on |
| status | not read | reprioritisations | ||
|---|---|---|---|---|
| last reprioritisation on | suggested re-reading day | |||
| started reading on | finished reading on |
| status | not read | reprioritisations | ||
|---|---|---|---|---|
| last reprioritisation on | suggested re-reading day | |||
| started reading on | finished reading on |
| status | not read | reprioritisations | ||
|---|---|---|---|---|
| last reprioritisation on | suggested re-reading day | |||
| started reading on | finished reading on |
| status | not read | reprioritisations | ||
|---|---|---|---|---|
| last reprioritisation on | suggested re-reading day | |||
| started reading on | finished reading on |
| status | not read | reprioritisations | ||
|---|---|---|---|---|
| last reprioritisation on | suggested re-reading day | |||
| started reading on | finished reading on |
| status | not read | reprioritisations | ||
|---|---|---|---|---|
| last reprioritisation on | suggested re-reading day | |||
| started reading on | finished reading on |
| status | not read | reprioritisations | ||
|---|---|---|---|---|
| last reprioritisation on | suggested re-reading day | |||
| started reading on | finished reading on |
| status | not read | reprioritisations | ||
|---|---|---|---|---|
| last reprioritisation on | suggested re-reading day | |||
| started reading on | finished reading on |
| status | not read | reprioritisations | ||
|---|---|---|---|---|
| last reprioritisation on | suggested re-reading day | |||
| started reading on | finished reading on |
| status | not read | reprioritisations | ||
|---|---|---|---|---|
| last reprioritisation on | suggested re-reading day | |||
| started reading on | finished reading on |
| status | not read | reprioritisations | ||
|---|---|---|---|---|
| last reprioritisation on | suggested re-reading day | |||
| started reading on | finished reading on |
| status | not read | reprioritisations | ||
|---|---|---|---|---|
| last reprioritisation on | suggested re-reading day | |||
| started reading on | finished reading on |
| status | not read | reprioritisations | ||
|---|---|---|---|---|
| last reprioritisation on | suggested re-reading day | |||
| started reading on | finished reading on |
| status | not read | reprioritisations | ||
|---|---|---|---|---|
| last reprioritisation on | suggested re-reading day | |||
| started reading on | finished reading on |
| status | not read | reprioritisations | ||
|---|---|---|---|---|
| last reprioritisation on | suggested re-reading day | |||
| started reading on | finished reading on |
| status | not read | reprioritisations | ||
|---|---|---|---|---|
| last reprioritisation on | suggested re-reading day | |||
| started reading on | finished reading on |
| status | not read | reprioritisations | ||
|---|---|---|---|---|
| last reprioritisation on | suggested re-reading day | |||
| started reading on | finished reading on |
| status | not read | reprioritisations | ||
|---|---|---|---|---|
| last reprioritisation on | suggested re-reading day | |||
| started reading on | finished reading on |
| status | not read | reprioritisations | ||
|---|---|---|---|---|
| last reprioritisation on | suggested re-reading day | |||
| started reading on | finished reading on |
| status | not read | reprioritisations | ||
|---|---|---|---|---|
| last reprioritisation on | suggested re-reading day | |||
| started reading on | finished reading on |
| status | not read | reprioritisations | ||
|---|---|---|---|---|
| last reprioritisation on | suggested re-reading day | |||
| started reading on | finished reading on |
| status | not read | reprioritisations | ||
|---|---|---|---|---|
| last reprioritisation on | suggested re-reading day | |||
| started reading on | finished reading on |
| status | not read | reprioritisations | ||
|---|---|---|---|---|
| last reprioritisation on | suggested re-reading day | |||
| started reading on | finished reading on |
| status | not read | reprioritisations | ||
|---|---|---|---|---|
| last reprioritisation on | suggested re-reading day | |||
| started reading on | finished reading on |
| status | not read | reprioritisations | ||
|---|---|---|---|---|
| last reprioritisation on | suggested re-reading day | |||
| started reading on | finished reading on |
| status | not read | reprioritisations | ||
|---|---|---|---|---|
| last reprioritisation on | suggested re-reading day | |||
| started reading on | finished reading on |
| status | not read | reprioritisations | ||
|---|---|---|---|---|
| last reprioritisation on | suggested re-reading day | |||
| started reading on | finished reading on |
| status | not read | reprioritisations | ||
|---|---|---|---|---|
| last reprioritisation on | suggested re-reading day | |||
| started reading on | finished reading on |
| status | not read | reprioritisations | ||
|---|---|---|---|---|
| last reprioritisation on | suggested re-reading day | |||
| started reading on | finished reading on |
| status | not read | reprioritisations | ||
|---|---|---|---|---|
| last reprioritisation on | suggested re-reading day | |||
| started reading on | finished reading on |
| status | not read | reprioritisations | ||
|---|---|---|---|---|
| last reprioritisation on | suggested re-reading day | |||
| started reading on | finished reading on |
| status | not read | reprioritisations | ||
|---|---|---|---|---|
| last reprioritisation on | suggested re-reading day | |||
| started reading on | finished reading on |
| status | not read | reprioritisations | ||
|---|---|---|---|---|
| last reprioritisation on | suggested re-reading day | |||
| started reading on | finished reading on |
| status | not read | reprioritisations | ||
|---|---|---|---|---|
| last reprioritisation on | suggested re-reading day | |||
| started reading on | finished reading on |
| status | not read | reprioritisations | ||
|---|---|---|---|---|
| last reprioritisation on | suggested re-reading day | |||
| started reading on | finished reading on |
| status | not read | reprioritisations | ||
|---|---|---|---|---|
| last reprioritisation on | suggested re-reading day | |||
| started reading on | finished reading on |