Edited, memorised or added to reading queue
on 12-Nov-2016 (Sat)
Do you want BuboFlash to help you learning these things? Click here to log in or create user.
| status | not read | reprioritisations | ||
|---|---|---|---|---|
| last reprioritisation on | suggested re-reading day | |||
| started reading on | finished reading on |


 .
.| status | not read | reprioritisations | ||
|---|---|---|---|---|
| last reprioritisation on | suggested re-reading day | |||
| started reading on | finished reading on |
| status | not read | reprioritisations | ||
|---|---|---|---|---|
| last reprioritisation on | suggested re-reading day | |||
| started reading on | finished reading on |
| status | not read | reprioritisations | ||
|---|---|---|---|---|
| last reprioritisation on | suggested re-reading day | |||
| started reading on | finished reading on |
| status | not read | reprioritisations | ||
|---|---|---|---|---|
| last reprioritisation on | suggested re-reading day | |||
| started reading on | finished reading on |
| status | not read | reprioritisations | ||
|---|---|---|---|---|
| last reprioritisation on | suggested re-reading day | |||
| started reading on | finished reading on |
| status | not read | reprioritisations | ||
|---|---|---|---|---|
| last reprioritisation on | suggested re-reading day | |||
| started reading on | finished reading on |
| status | not read | reprioritisations | ||
|---|---|---|---|---|
| last reprioritisation on | suggested re-reading day | |||
| started reading on | finished reading on |
| status | not read | reprioritisations | ||
|---|---|---|---|---|
| last reprioritisation on | suggested re-reading day | |||
| started reading on | finished reading on |
| status | not read | reprioritisations | ||
|---|---|---|---|---|
| last reprioritisation on | suggested re-reading day | |||
| started reading on | finished reading on |
| status | not read | reprioritisations | ||
|---|---|---|---|---|
| last reprioritisation on | suggested re-reading day | |||
| started reading on | finished reading on |
| status | not read | reprioritisations | ||
|---|---|---|---|---|
| last reprioritisation on | suggested re-reading day | |||
| started reading on | finished reading on |


| status | not read | reprioritisations | ||
|---|---|---|---|---|
| last reprioritisation on | suggested re-reading day | |||
| started reading on | finished reading on |
| status | not read | reprioritisations | ||
|---|---|---|---|---|
| last reprioritisation on | suggested re-reading day | |||
| started reading on | finished reading on |


| status | not read | reprioritisations | ||
|---|---|---|---|---|
| last reprioritisation on | suggested re-reading day | |||
| started reading on | finished reading on |


| status | not read | reprioritisations | ||
|---|---|---|---|---|
| last reprioritisation on | suggested re-reading day | |||
| started reading on | finished reading on |


| status | not read | reprioritisations | ||
|---|---|---|---|---|
| last reprioritisation on | suggested re-reading day | |||
| started reading on | finished reading on |

| status | not read | reprioritisations | ||
|---|---|---|---|---|
| last reprioritisation on | suggested re-reading day | |||
| started reading on | finished reading on |

| status | not read | reprioritisations | ||
|---|---|---|---|---|
| last reprioritisation on | suggested re-reading day | |||
| started reading on | finished reading on |


| status | not read | reprioritisations | ||
|---|---|---|---|---|
| last reprioritisation on | suggested re-reading day | |||
| started reading on | finished reading on |


| status | not read | reprioritisations | ||
|---|---|---|---|---|
| last reprioritisation on | suggested re-reading day | |||
| started reading on | finished reading on |


| status | not read | reprioritisations | ||
|---|---|---|---|---|
| last reprioritisation on | suggested re-reading day | |||
| started reading on | finished reading on |


| status | not read | reprioritisations | ||
|---|---|---|---|---|
| last reprioritisation on | suggested re-reading day | |||
| started reading on | finished reading on |


| status | not read | reprioritisations | ||
|---|---|---|---|---|
| last reprioritisation on | suggested re-reading day | |||
| started reading on | finished reading on |


| status | not read | reprioritisations | ||
|---|---|---|---|---|
| last reprioritisation on | suggested re-reading day | |||
| started reading on | finished reading on |


| status | not read | reprioritisations | ||
|---|---|---|---|---|
| last reprioritisation on | suggested re-reading day | |||
| started reading on | finished reading on |


| status | not read | reprioritisations | ||
|---|---|---|---|---|
| last reprioritisation on | suggested re-reading day | |||
| started reading on | finished reading on |


| status | not read | reprioritisations | ||
|---|---|---|---|---|
| last reprioritisation on | suggested re-reading day | |||
| started reading on | finished reading on |


| status | not read | reprioritisations | ||
|---|---|---|---|---|
| last reprioritisation on | suggested re-reading day | |||
| started reading on | finished reading on |
| status | not read | reprioritisations | ||
|---|---|---|---|---|
| last reprioritisation on | suggested re-reading day | |||
| started reading on | finished reading on |


| status | not read | reprioritisations | ||
|---|---|---|---|---|
| last reprioritisation on | suggested re-reading day | |||
| started reading on | finished reading on |


| status | not read | reprioritisations | ||
|---|---|---|---|---|
| last reprioritisation on | suggested re-reading day | |||
| started reading on | finished reading on |

| status | not read | reprioritisations | ||
|---|---|---|---|---|
| last reprioritisation on | suggested re-reading day | |||
| started reading on | finished reading on |

| status | not read | reprioritisations | ||
|---|---|---|---|---|
| last reprioritisation on | suggested re-reading day | |||
| started reading on | finished reading on |


| status | not read | reprioritisations | ||
|---|---|---|---|---|
| last reprioritisation on | suggested re-reading day | |||
| started reading on | finished reading on |
| status | not read | reprioritisations | ||
|---|---|---|---|---|
| last reprioritisation on | suggested re-reading day | |||
| started reading on | finished reading on |
| status | not read | reprioritisations | ||
|---|---|---|---|---|
| last reprioritisation on | suggested re-reading day | |||
| started reading on | finished reading on |
| status | not read | reprioritisations | ||
|---|---|---|---|---|
| last reprioritisation on | suggested re-reading day | |||
| started reading on | finished reading on |


| status | not read | reprioritisations | ||
|---|---|---|---|---|
| last reprioritisation on | suggested re-reading day | |||
| started reading on | finished reading on |


| status | not read | reprioritisations | ||
|---|---|---|---|---|
| last reprioritisation on | suggested re-reading day | |||
| started reading on | finished reading on |


| status | not read | reprioritisations | ||
|---|---|---|---|---|
| last reprioritisation on | suggested re-reading day | |||
| started reading on | finished reading on |


| status | not read | reprioritisations | ||
|---|---|---|---|---|
| last reprioritisation on | suggested re-reading day | |||
| started reading on | finished reading on |
| status | not read | reprioritisations | ||
|---|---|---|---|---|
| last reprioritisation on | suggested re-reading day | |||
| started reading on | finished reading on |

| status | not read | reprioritisations | ||
|---|---|---|---|---|
| last reprioritisation on | suggested re-reading day | |||
| started reading on | finished reading on |
| status | not read | reprioritisations | ||
|---|---|---|---|---|
| last reprioritisation on | suggested re-reading day | |||
| started reading on | finished reading on |

| status | not read | reprioritisations | ||
|---|---|---|---|---|
| last reprioritisation on | suggested re-reading day | |||
| started reading on | finished reading on |

| status | not read | reprioritisations | ||
|---|---|---|---|---|
| last reprioritisation on | suggested re-reading day | |||
| started reading on | finished reading on |
| status | not read | reprioritisations | ||
|---|---|---|---|---|
| last reprioritisation on | suggested re-reading day | |||
| started reading on | finished reading on |
| status | not read | reprioritisations | ||
|---|---|---|---|---|
| last reprioritisation on | suggested re-reading day | |||
| started reading on | finished reading on |


| status | not read | reprioritisations | ||
|---|---|---|---|---|
| last reprioritisation on | suggested re-reading day | |||
| started reading on | finished reading on |
| status | not read | reprioritisations | ||
|---|---|---|---|---|
| last reprioritisation on | suggested re-reading day | |||
| started reading on | finished reading on |

| status | not read | reprioritisations | ||
|---|---|---|---|---|
| last reprioritisation on | suggested re-reading day | |||
| started reading on | finished reading on |
| status | not read | reprioritisations | ||
|---|---|---|---|---|
| last reprioritisation on | suggested re-reading day | |||
| started reading on | finished reading on |
| status | not read | reprioritisations | ||
|---|---|---|---|---|
| last reprioritisation on | suggested re-reading day | |||
| started reading on | finished reading on |
| status | not read | reprioritisations | ||
|---|---|---|---|---|
| last reprioritisation on | suggested re-reading day | |||
| started reading on | finished reading on |
| status | not read | reprioritisations | ||
|---|---|---|---|---|
| last reprioritisation on | suggested re-reading day | |||
| started reading on | finished reading on |
| status | not read | reprioritisations | ||
|---|---|---|---|---|
| last reprioritisation on | suggested re-reading day | |||
| started reading on | finished reading on |
| status | not read | reprioritisations | ||
|---|---|---|---|---|
| last reprioritisation on | suggested re-reading day | |||
| started reading on | finished reading on |


| status | not read | reprioritisations | ||
|---|---|---|---|---|
| last reprioritisation on | suggested re-reading day | |||
| started reading on | finished reading on |


| status | not read | reprioritisations | ||
|---|---|---|---|---|
| last reprioritisation on | suggested re-reading day | |||
| started reading on | finished reading on |
| status | not read | reprioritisations | ||
|---|---|---|---|---|
| last reprioritisation on | suggested re-reading day | |||
| started reading on | finished reading on |
| status | not read | reprioritisations | ||
|---|---|---|---|---|
| last reprioritisation on | suggested re-reading day | |||
| started reading on | finished reading on |

| status | not read | reprioritisations | ||
|---|---|---|---|---|
| last reprioritisation on | suggested re-reading day | |||
| started reading on | finished reading on |

| status | not read | reprioritisations | ||
|---|---|---|---|---|
| last reprioritisation on | suggested re-reading day | |||
| started reading on | finished reading on |
| status | not read | reprioritisations | ||
|---|---|---|---|---|
| last reprioritisation on | suggested re-reading day | |||
| started reading on | finished reading on |


| status | not read | reprioritisations | ||
|---|---|---|---|---|
| last reprioritisation on | suggested re-reading day | |||
| started reading on | finished reading on |
| status | not read | reprioritisations | ||
|---|---|---|---|---|
| last reprioritisation on | suggested re-reading day | |||
| started reading on | finished reading on |


| status | not read | reprioritisations | ||
|---|---|---|---|---|
| last reprioritisation on | suggested re-reading day | |||
| started reading on | finished reading on |
| status | not read | reprioritisations | ||
|---|---|---|---|---|
| last reprioritisation on | suggested re-reading day | |||
| started reading on | finished reading on |
Flashcard 1419197680908
| status | not learned | measured difficulty | 37% [default] | last interval [days] | |||
|---|---|---|---|---|---|---|---|
| repetition number in this series | 0 | memorised on | scheduled repetition | ||||
| scheduled repetition interval | last repetition or drill |
Flashcard 1419199515916
| status | not learned | measured difficulty | 37% [default] | last interval [days] | |||
|---|---|---|---|---|---|---|---|
| repetition number in this series | 0 | memorised on | scheduled repetition | ||||
| scheduled repetition interval | last repetition or drill |
Flashcard 1419201350924
| status | not learned | measured difficulty | 37% [default] | last interval [days] | |||
|---|---|---|---|---|---|---|---|
| repetition number in this series | 0 | memorised on | scheduled repetition | ||||
| scheduled repetition interval | last repetition or drill |
Flashcard 1419203185932
| status | not learned | measured difficulty | 37% [default] | last interval [days] | |||
|---|---|---|---|---|---|---|---|
| repetition number in this series | 0 | memorised on | scheduled repetition | ||||
| scheduled repetition interval | last repetition or drill |
Flashcard 1419205283084
| status | not learned | measured difficulty | 37% [default] | last interval [days] | |||
|---|---|---|---|---|---|---|---|
| repetition number in this series | 0 | memorised on | scheduled repetition | ||||
| scheduled repetition interval | last repetition or drill |
Flashcard 1419207380236
| status | not learned | measured difficulty | 37% [default] | last interval [days] | |||
|---|---|---|---|---|---|---|---|
| repetition number in this series | 0 | memorised on | scheduled repetition | ||||
| scheduled repetition interval | last repetition or drill |
Flashcard 1419209215244
| status | not learned | measured difficulty | 37% [default] | last interval [days] | |||
|---|---|---|---|---|---|---|---|
| repetition number in this series | 0 | memorised on | scheduled repetition | ||||
| scheduled repetition interval | last repetition or drill |
Flashcard 1419211050252
| status | not learned | measured difficulty | 37% [default] | last interval [days] | |||
|---|---|---|---|---|---|---|---|
| repetition number in this series | 0 | memorised on | scheduled repetition | ||||
| scheduled repetition interval | last repetition or drill |
Flashcard 1419212885260
| status | not learned | measured difficulty | 37% [default] | last interval [days] | |||
|---|---|---|---|---|---|---|---|
| repetition number in this series | 0 | memorised on | scheduled repetition | ||||
| scheduled repetition interval | last repetition or drill |
Flashcard 1419214720268
| status | not learned | measured difficulty | 37% [default] | last interval [days] | |||
|---|---|---|---|---|---|---|---|
| repetition number in this series | 0 | memorised on | scheduled repetition | ||||
| scheduled repetition interval | last repetition or drill |
Flashcard 1419216555276
| status | not learned | measured difficulty | 37% [default] | last interval [days] | |||
|---|---|---|---|---|---|---|---|
| repetition number in this series | 0 | memorised on | scheduled repetition | ||||
| scheduled repetition interval | last repetition or drill |
Flashcard 1419218652428
| status | not learned | measured difficulty | 37% [default] | last interval [days] | |||
|---|---|---|---|---|---|---|---|
| repetition number in this series | 0 | memorised on | scheduled repetition | ||||
| scheduled repetition interval | last repetition or drill |
Flashcard 1419220487436
| status | not learned | measured difficulty | 37% [default] | last interval [days] | |||
|---|---|---|---|---|---|---|---|
| repetition number in this series | 0 | memorised on | scheduled repetition | ||||
| scheduled repetition interval | last repetition or drill |
Flashcard 1419222322444
| status | not learned | measured difficulty | 37% [default] | last interval [days] | |||
|---|---|---|---|---|---|---|---|
| repetition number in this series | 0 | memorised on | scheduled repetition | ||||
| scheduled repetition interval | last repetition or drill |
Flashcard 1419224157452
| status | not learned | measured difficulty | 37% [default] | last interval [days] | |||
|---|---|---|---|---|---|---|---|
| repetition number in this series | 0 | memorised on | scheduled repetition | ||||
| scheduled repetition interval | last repetition or drill |
Flashcard 1419225992460
| status | not learned | measured difficulty | 37% [default] | last interval [days] | |||
|---|---|---|---|---|---|---|---|
| repetition number in this series | 0 | memorised on | scheduled repetition | ||||
| scheduled repetition interval | last repetition or drill |
Flashcard 1419228089612
| status | not learned | measured difficulty | 37% [default] | last interval [days] | |||
|---|---|---|---|---|---|---|---|
| repetition number in this series | 0 | memorised on | scheduled repetition | ||||
| scheduled repetition interval | last repetition or drill |
Flashcard 1419229924620
| status | not learned | measured difficulty | 37% [default] | last interval [days] | |||
|---|---|---|---|---|---|---|---|
| repetition number in this series | 0 | memorised on | scheduled repetition | ||||
| scheduled repetition interval | last repetition or drill |
Flashcard 1419231759628
| status | not learned | measured difficulty | 37% [default] | last interval [days] | |||
|---|---|---|---|---|---|---|---|
| repetition number in this series | 0 | memorised on | scheduled repetition | ||||
| scheduled repetition interval | last repetition or drill |
Flashcard 1419233856780
| status | not learned | measured difficulty | 37% [default] | last interval [days] | |||
|---|---|---|---|---|---|---|---|
| repetition number in this series | 0 | memorised on | scheduled repetition | ||||
| scheduled repetition interval | last repetition or drill |
Flashcard 1419235691788
| status | not learned | measured difficulty | 37% [default] | last interval [days] | |||
|---|---|---|---|---|---|---|---|
| repetition number in this series | 0 | memorised on | scheduled repetition | ||||
| scheduled repetition interval | last repetition or drill |
Flashcard 1419237526796
| status | not learned | measured difficulty | 37% [default] | last interval [days] | |||
|---|---|---|---|---|---|---|---|
| repetition number in this series | 0 | memorised on | scheduled repetition | ||||
| scheduled repetition interval | last repetition or drill |
Flashcard 1419239361804
| status | not learned | measured difficulty | 37% [default] | last interval [days] | |||
|---|---|---|---|---|---|---|---|
| repetition number in this series | 0 | memorised on | scheduled repetition | ||||
| scheduled repetition interval | last repetition or drill |
Flashcard 1419241196812
| status | not learned | measured difficulty | 37% [default] | last interval [days] | |||
|---|---|---|---|---|---|---|---|
| repetition number in this series | 0 | memorised on | scheduled repetition | ||||
| scheduled repetition interval | last repetition or drill |
Flashcard 1419243031820
| status | not learned | measured difficulty | 37% [default] | last interval [days] | |||
|---|---|---|---|---|---|---|---|
| repetition number in this series | 0 | memorised on | scheduled repetition | ||||
| scheduled repetition interval | last repetition or drill |
Flashcard 1419244866828
| status | not learned | measured difficulty | 37% [default] | last interval [days] | |||
|---|---|---|---|---|---|---|---|
| repetition number in this series | 0 | memorised on | scheduled repetition | ||||
| scheduled repetition interval | last repetition or drill |
Flashcard 1419246701836
| status | not learned | measured difficulty | 37% [default] | last interval [days] | |||
|---|---|---|---|---|---|---|---|
| repetition number in this series | 0 | memorised on | scheduled repetition | ||||
| scheduled repetition interval | last repetition or drill |
Flashcard 1419248536844
| status | not learned | measured difficulty | 37% [default] | last interval [days] | |||
|---|---|---|---|---|---|---|---|
| repetition number in this series | 0 | memorised on | scheduled repetition | ||||
| scheduled repetition interval | last repetition or drill |
Flashcard 1419250371852
| status | not learned | measured difficulty | 37% [default] | last interval [days] | |||
|---|---|---|---|---|---|---|---|
| repetition number in this series | 0 | memorised on | scheduled repetition | ||||
| scheduled repetition interval | last repetition or drill |
Flashcard 1419252206860
| status | not learned | measured difficulty | 37% [default] | last interval [days] | |||
|---|---|---|---|---|---|---|---|
| repetition number in this series | 0 | memorised on | scheduled repetition | ||||
| scheduled repetition interval | last repetition or drill |
Flashcard 1419254041868
| status | not learned | measured difficulty | 37% [default] | last interval [days] | |||
|---|---|---|---|---|---|---|---|
| repetition number in this series | 0 | memorised on | scheduled repetition | ||||
| scheduled repetition interval | last repetition or drill |
| status | not read | reprioritisations | ||
|---|---|---|---|---|
| last reprioritisation on | suggested re-reading day | |||
| started reading on | finished reading on |
| status | not read | reprioritisations | ||
|---|---|---|---|---|
| last reprioritisation on | suggested re-reading day | |||
| started reading on | finished reading on |
| status | not read | reprioritisations | ||
|---|---|---|---|---|
| last reprioritisation on | suggested re-reading day | |||
| started reading on | finished reading on |
| status | not read | reprioritisations | ||
|---|---|---|---|---|
| last reprioritisation on | suggested re-reading day | |||
| started reading on | finished reading on |
| status | not read | reprioritisations | ||
|---|---|---|---|---|
| last reprioritisation on | suggested re-reading day | |||
| started reading on | finished reading on |
| status | not read | reprioritisations | ||
|---|---|---|---|---|
| last reprioritisation on | suggested re-reading day | |||
| started reading on | finished reading on |
| status | not read | reprioritisations | ||
|---|---|---|---|---|
| last reprioritisation on | suggested re-reading day | |||
| started reading on | finished reading on |
| status | not read | reprioritisations | ||
|---|---|---|---|---|
| last reprioritisation on | suggested re-reading day | |||
| started reading on | finished reading on |
| status | not read | reprioritisations | ||
|---|---|---|---|---|
| last reprioritisation on | suggested re-reading day | |||
| started reading on | finished reading on |
| status | not read | reprioritisations | ||
|---|---|---|---|---|
| last reprioritisation on | suggested re-reading day | |||
| started reading on | finished reading on |
| status | not read | reprioritisations | ||
|---|---|---|---|---|
| last reprioritisation on | suggested re-reading day | |||
| started reading on | finished reading on |
| status | not read | reprioritisations | ||
|---|---|---|---|---|
| last reprioritisation on | suggested re-reading day | |||
| started reading on | finished reading on |
| status | not read | reprioritisations | ||
|---|---|---|---|---|
| last reprioritisation on | suggested re-reading day | |||
| started reading on | finished reading on |
| status | not read | reprioritisations | ||
|---|---|---|---|---|
| last reprioritisation on | suggested re-reading day | |||
| started reading on | finished reading on |
| status | not read | reprioritisations | ||
|---|---|---|---|---|
| last reprioritisation on | suggested re-reading day | |||
| started reading on | finished reading on |
| status | not read | reprioritisations | ||
|---|---|---|---|---|
| last reprioritisation on | suggested re-reading day | |||
| started reading on | finished reading on |
| status | not read | reprioritisations | ||
|---|---|---|---|---|
| last reprioritisation on | suggested re-reading day | |||
| started reading on | finished reading on |
| status | not read | reprioritisations | ||
|---|---|---|---|---|
| last reprioritisation on | suggested re-reading day | |||
| started reading on | finished reading on |
| status | not read | reprioritisations | ||
|---|---|---|---|---|
| last reprioritisation on | suggested re-reading day | |||
| started reading on | finished reading on |
| status | not read | reprioritisations | ||
|---|---|---|---|---|
| last reprioritisation on | suggested re-reading day | |||
| started reading on | finished reading on |
| status | not read | reprioritisations | ||
|---|---|---|---|---|
| last reprioritisation on | suggested re-reading day | |||
| started reading on | finished reading on |
| status | not read | reprioritisations | ||
|---|---|---|---|---|
| last reprioritisation on | suggested re-reading day | |||
| started reading on | finished reading on |
| status | not read | reprioritisations | ||
|---|---|---|---|---|
| last reprioritisation on | suggested re-reading day | |||
| started reading on | finished reading on |
| status | not read | reprioritisations | ||
|---|---|---|---|---|
| last reprioritisation on | suggested re-reading day | |||
| started reading on | finished reading on |
| status | not read | reprioritisations | ||
|---|---|---|---|---|
| last reprioritisation on | suggested re-reading day | |||
| started reading on | finished reading on |
| status | not read | reprioritisations | ||
|---|---|---|---|---|
| last reprioritisation on | suggested re-reading day | |||
| started reading on | finished reading on |
| status | not read | reprioritisations | ||
|---|---|---|---|---|
| last reprioritisation on | suggested re-reading day | |||
| started reading on | finished reading on |
| status | not read | reprioritisations | ||
|---|---|---|---|---|
| last reprioritisation on | suggested re-reading day | |||
| started reading on | finished reading on |
| status | not read | reprioritisations | ||
|---|---|---|---|---|
| last reprioritisation on | suggested re-reading day | |||
| started reading on | finished reading on |
| status | not read | reprioritisations | ||
|---|---|---|---|---|
| last reprioritisation on | suggested re-reading day | |||
| started reading on | finished reading on |
| status | not read | reprioritisations | ||
|---|---|---|---|---|
| last reprioritisation on | suggested re-reading day | |||
| started reading on | finished reading on |
| status | not read | reprioritisations | ||
|---|---|---|---|---|
| last reprioritisation on | suggested re-reading day | |||
| started reading on | finished reading on |
| status | not read | reprioritisations | ||
|---|---|---|---|---|
| last reprioritisation on | suggested re-reading day | |||
| started reading on | finished reading on |
Subject 3. Market pricing anomalies
Time-Series Anomalies Calendar anomalies question whether some regularities exist in the rates of return during the calendar year that would allow investors to predict returns on stocks. <span>The January anomaly, also called small-firm-in-January effect, says that many people sell stocks that have declined in price during the previous months to realize their capital losses before the end of the tax year. Such investors do not put the proceeds from these sales back into the stock market until after the turn of the year. At that point the rush of demand for stock places an upward pressure on prices that results in the January effect. The effect is said to show up most dramatically for the smallest firms because the small-firm group includes stocks with the greatest variability of prices during the year (and the group therefore includes a relatively large number of firms that have declined sufficiently to induce tax-loss selling). Another possible reason for January effect on stock markets is strategic selling by institutional investors at the end of their reporting periods. Portfolio managers may be reluctant to report holdings of stocks in their annual reports that have performed poorly in the previous period. Therefore, the managers sell these stocks at the end of their accounting periods (usually end of December). This so-called window-dressing was suggested as a source of the January effect by Haugen and Lakonishok (1988). Despite numerous studies, the January anomaly poses as many questions as it answers. Other calendar studies include monthly effect, weekend or day of the week effect, and intraday effect. Momentum and Overreaction Anomalies. The debate surrounding investor overreaction and contrarian investing is one of the most extensive and controversial areas of re
| status | not read | reprioritisations | ||
|---|---|---|---|---|
| last reprioritisation on | suggested re-reading day | |||
| started reading on | finished reading on |
Subject 3. Market pricing anomalies
Despite numerous studies, the January anomaly poses as many questions as it answers. Other calendar studies include monthly effect, weekend or day of the week effect, and intraday effect. <span>Momentum and Overreaction Anomalies. The debate surrounding investor overreaction and contrarian investing is one of the most extensive and controversial areas of research in finance. The overreaction anomaly, evidenced by long-term reversals in stock returns, was first identified by De Bondt and Thaler (1985), who showed that stocks which perform poorly in the past three to five years demonstrate superior performance over the next three to five years compared to stocks that have performed well in the past. The study provided evidence that abnormal excess returns could be gained by employing a strategy of buying past losers and selling short past winners, or the contrarian strategy. Although the overreaction anomaly and market momentum do seem to exist, researchers have argued that the existence of momentum is rational, and the additional return (based on the contrarian investment strategy) would come simply at the expense of increased risk. Cross-Sectional Anomalies If the semi-strong EMH is true, all securities should have equal risk-adjusted returns because security prices should r
| status | not read | reprioritisations | ||
|---|---|---|---|---|
| last reprioritisation on | suggested re-reading day | |||
| started reading on | finished reading on |
Subject 3. Market pricing anomalies
Are the hypotheses supported by the data? Are there market patterns that lead to abnormal returns more often than not? A market anomaly is a security price distortion in the market that seems to contradict the efficient market hypothesis. There are different categories of market anomalies. Time-Series Anomalies Calendar anomalies question whether some regularities exist in the rates of return during the calendar year that would allow investors to predict returns on stocks. The January anomaly, also called small-firm-in-January effect, says that many people sell stocks that have declined in price during the previous months to realize th
| status | not read | reprioritisations | ||
|---|---|---|---|---|
| last reprioritisation on | suggested re-reading day | |||
| started reading on | finished reading on |
Subject 3. Market pricing anomalies
ket momentum do seem to exist, researchers have argued that the existence of momentum is rational, and the additional return (based on the contrarian investment strategy) would come simply at the expense of increased risk. <span>Cross-Sectional Anomalies If the semi-strong EMH is true, all securities should have equal risk-adjusted returns because security prices should reflect all public information that would influence the security's risk. Using public information, is it possible to determine what stocks will enjoy above-average, risk-adjusted returns? The size effect relates to the impact of size (measured by the total market value) on risk-adjusted rates of return. Some researchers found that the small firms outperformed the large firms after considering risk and transaction costs. Basu's study concluded that publicly available P/E ratios possessed valuable information, and the risk-adjusted returns for stocks in the lowest P/E ratio quintile were superior to those in the highest P/E ratio quintile. This is known as the value effect. Fama and French found that both size and BV/MV ratio are significant when included together, and they dominate other ratios. The dramatic dependence of returns on market-to-book ratio is independent of beta, suggesting either that low market-to-book ratio firms are relatively underpriced, or that the market-to-book ratio is serving as a proxy for a risk factor that affects equilibrium expected returns. Other Anomalies Closed-End Investment Fund Discounts. Closed-end funds usually trade at substantial discounts relative to their net asset values.
| status | not read | reprioritisations | ||
|---|---|---|---|---|
| last reprioritisation on | suggested re-reading day | |||
| started reading on | finished reading on |
Subject 3. Market pricing anomalies
either that low market-to-book ratio firms are relatively underpriced, or that the market-to-book ratio is serving as a proxy for a risk factor that affects equilibrium expected returns. Other Anomalies <span>Closed-End Investment Fund Discounts. Closed-end funds usually trade at substantial discounts relative to their net asset values. There are several types of explanations: Agency costs. The existence of management fees (from 0.5% to 2%) implies that funds will sell at a discount. However, open-end funds also charge fees. Boudreaux (1973) suggested that since fund managers buy and sell securities, discounts might reflect their differential ability to perform this task. However, this explanation does not explain why funds trade, on average, at discounts. Taxes. When a fund realizes a capital gain it must report this, and the tax liability is borne by the existing shareholders at the time the gain is realized. So if you buy a fund today and it realizes a large capital gain tomorrow, you must pay a tax even if you have not made any money. This implies that a fund with large unrealized capital appreciation is worth less than net asset value to both existing and potential shareholders, and should thus sell at a discount. The explanation, like the others, has some apparent merit but fails to explain all the facts. Liquidity. One way in which the portfolio might be misvalued is if the fund held large quantities of stocks which cannot be freely sold in the open market. Such stocks, some have argued, are valued too highly in the calculation of net asset value. However, most closed-end funds hold little or no restricted stock and yet still sell at discounts. When closed-end funds are terminated, either through merger, liquidation, or conversion to an open-end fund, prices converge to reported net asset value. In summary, a number of reasons have been put forth to explain closed-end fund discounts in the context of the efficient market hypothesis and rational agents. Several of these factors do have some merits, but taken together, these factors explain only a small portion of the total variation in discounts. Earning surprises. Price changes tend to persist after initial announcements. Stocks with positive surprises tend to drift upward, those with negative surprises tend
| status | not read | reprioritisations | ||
|---|---|---|---|---|
| last reprioritisation on | suggested re-reading day | |||
| started reading on | finished reading on |
Subject 3. Market pricing anomalies
ounts in the context of the efficient market hypothesis and rational agents. Several of these factors do have some merits, but taken together, these factors explain only a small portion of the total variation in discounts. <span>Earning surprises. Price changes tend to persist after initial announcements. Stocks with positive surprises tend to drift upward, those with negative surprises tend to drift downward. Some refer to the likelihood of positive earnings surprises to be followed by several more earnings surprises as the "cockroach" theory because when you find one, there are likely to be more in hiding. Researches show that the post-earnings-announcement drift occurs mainly in the highly illiquid stocks, which have high trading costs and market impact costs, thus supporting for the argument that transactions costs could be the source of the drift. Initial public offerings. Because of uncertainty about price and the risk involved in underwriting stocks of previously closely held companies, it has been hypothesized that underwriters tend to under-price these new issues. Although there is some under-pricing of IPOs (about 15%) when they are offered, the price adjustment takes place within one day after the offering. Investors who acquire the stock after the initial adjustment do not experience abnormal returns. Predictability of returns based on prior information. Finding that stock returns are related to prior information such as interest rates, inflation rates and dividend yields would not result in abnormal trading returns. Summary Most empirical evidence supports the semi-strong form EMH. The test results of the strong-form EMH are mixed.<span><body><html>
| status | not read | reprioritisations | ||
|---|---|---|---|---|
| last reprioritisation on | suggested re-reading day | |||
| started reading on | finished reading on |
Subject 4. Behavioral finance
Some investors behave highly irrationally and make predictable errors. Behavior finance is a field of finance that proposes psychology-based theories to explain stock market anomalies. Within behavioral finance, it is assumed that the information structure and the characteristics of market participants systematically influence individuals' investment decisions as well as market outcomes. There have been many studies that have documented long-term historical phenomena in securities markets that contradict the efficient market hypothesis and cannot be captured plausibly in models based on perfect investor rationality. Behavioral finance attempts to fill the void. Loss Aversion It is a theory that people value gains and losses differently and, as such, will base decisions on perceived losses rather than perceived
| status | not read | reprioritisations | ||
|---|---|---|---|---|
| last reprioritisation on | suggested re-reading day | |||
| started reading on | finished reading on |
Subject 4. Behavioral finance
long-term historical phenomena in securities markets that contradict the efficient market hypothesis and cannot be captured plausibly in models based on perfect investor rationality. Behavioral finance attempts to fill the void. <span>Loss Aversion It is a theory that people value gains and losses differently and, as such, will base decisions on perceived losses rather than perceived gains. Thus, if a person were given two equal choices, one expressed in terms of possible losses and the other in possible gains, people would choose the former. Overconfidence Most people consider themselves to be better than average in most things they do. For example, 80% of drivers contend that they ar
| status | not read | reprioritisations | ||
|---|---|---|---|---|
| last reprioritisation on | suggested re-reading day | |||
| started reading on | finished reading on |
Subject 4. Behavioral finance
ill base decisions on perceived losses rather than perceived gains. Thus, if a person were given two equal choices, one expressed in terms of possible losses and the other in possible gains, people would choose the former. <span>Overconfidence Most people consider themselves to be better than average in most things they do. For example, 80% of drivers contend that they are better than "average" drivers. Is that really possible? Studies show that money managers, advisors, and investors are consistently overconfident in their ability to outperform the market. Most fail to do so, however. Other behavior theories include representativeness, gambler's fallacy, mental accounting, etc. Information Cascades Information cascading is defined as a situation in which an individual imitates the trades of other market participants and
| status | not read | reprioritisations | ||
|---|---|---|---|---|
| last reprioritisation on | suggested re-reading day | |||
| started reading on | finished reading on |
Subject 4. Behavioral finance
eir ability to outperform the market. Most fail to do so, however. Other behavior theories include representativeness, gambler's fallacy, mental accounting, etc. Information Cascades <span>Information cascading is defined as a situation in which an individual imitates the trades of other market participants and completely disregards his or her own private information. A related concept is herding, which is clustered trading that may or may not be based on information. Some researchers argue that institutional investors trade together because they receive correlated private information or infer private information from previous trades, and institutional herding helps prices to more quickly reflect market information and improve market efficiency. The result is that trading does not incorporate information and prices can move away from fundamentals. Some researchers argue that information cascades help promote market efficiency.<span><body><html>
| status | not read | reprioritisations | ||
|---|---|---|---|---|
| last reprioritisation on | suggested re-reading day | |||
| started reading on | finished reading on |
Open it
questo esame non finisce mai, sempre presenti per l'appello, stanchi, ancora in ballo, l'intervallo qui non arriva mai. e' meglio che la inventi la risposta quando non la sai, perche' poi sono sempre pronti a screditarti, a biasimarti, e subito pronti a rubarti il posto quando stai per rilassarti, non puoi adagiarti. conviene piu' studiare perché sarai sempre ignorante se e' la vita e' il professore, mio signore, dammi la forza per alzarmi anche domani, e di guadagnarmi il pane con le mie mani, ma... i figli della mia citta'nascono muti e la colomba bianca ormai si nutre di rifiuti. e' una pioggia malata che ci bagna, un blues che ci accompagna, in piedi alla lavagna abbiamo...zero tempo per giocare sai perche' c'e' che... c'e' che ogni giorno tocca a me. zero tempo per giocare sai perche' c'e' che... ogni giorno tocca a me. zero tempo per giocare sai perche' c'e' che... c'e' che tocca a me, tocca a me. zero tempo per giocare sai perche' c'e' che... quando tocca a me, tocca a me.ogni giorno tocca a me, zero tempo per giocare, lo vorrei fare, ma questa scuola non si puo' bigiare, lo sa mia madre la mattina che va a lavorare, lo sa ogni uomo su questa terra messo
| status | not read | reprioritisations | ||
|---|---|---|---|---|
| last reprioritisation on | suggested re-reading day | |||
| started reading on | finished reading on |
Open it
no tocca a me. zero tempo per giocare sai perche' c'e' che... ogni giorno tocca a me. zero tempo per giocare sai perche' c'e' che... c'e' che tocca a me, tocca a me. zero tempo per giocare sai perche' c'e' che... quando tocca a me, tocca a me.<span>ogni giorno tocca a me, zero tempo per giocare, lo vorrei fare, ma questa scuola non si puo' bigiare, lo sa mia madre la mattina che va a lavorare, lo sa ogni uomo su questa terra messo alla sbarra che non puo' più volare, lo sa mio nonno che ha sparato e pianto in guerra. soffoco, manca ossigeno, sono carico di zavorra, raggi di odio creano questo effetto serra, dentro il cuore noto un senso di torpore, l'amore sembra dormire invece muore. e un rumore il
| status | not read | reprioritisations | ||
|---|---|---|---|---|
| last reprioritisation on | suggested re-reading day | |||
| started reading on | finished reading on |
Secrets
Of course, there are many things we don’t yet understand, but some of those things may be impossible to figure out—mysteries rather than secrets. For example, string theory describes the physics of the universe in terms of vibrating one-dimensional objects called “strings.” Is string theory true? You can’t really design experiments to test it. Very few people, if any, could ever understand all its implications. But is that just because it’s difficult? Or is it an impossible mystery? The difference matters. You can achieve difficult things, but you can’t achieve the impossible. Recall the business version of our contrarian question: what valuable company is nobody building? Every correct answer is necessarily a secret: something important and unknown, something hard to do but doable. If there are many secrets left in the world, there are probably many worldchanging companies yet to be started. This chapter will help you think about secrets and how to find them.
| status | not read | reprioritisations | ||
|---|---|---|---|---|
| last reprioritisation on | suggested re-reading day | |||
| started reading on | finished reading on |
Build it and theyll come?
EVEN THOUGH SALES is everywhere, most people underrate its importance. Silicon Valley underrates it more than most. The geek classic The Hitchhiker’s Guide to the Galaxy even explains the founding of our planet as a reaction against salesmen. When an imminent catastrophe requires the evacuation of humanity’s original home, the population escapes on three giant ships. The thinkers, leaders, and achievers take the A Ship; the salespeople and consultants get the B Ship; and the workers and artisans take the C Ship. The B Ship leaves first, and all its passengers rejoice vainly. But the salespeople don’t realize they are caught in a ruse: the A Ship and C Ship people had always thought that the B Ship people were useless, so they conspired to get rid of them. And it was the B Ship that landed on Earth. Distribution may not matter in fictional worlds, but it matters in ours. We underestimate the importance of distribution—a catchall term for everything it takes to sell a product—because we share the same bias the A Ship and C Ship people had: salespeople and other “middlemen” supposedly get in the way, and distribution should flow magically from the creation of a good product. The Field of Dreams conceit is especially popular in Silicon Valley, where engineers are biased toward building cool stuff rather than selling it. But customers will not come just because you build it. You have to make that happen, and it’s harder than it looks.
| status | not read | reprioritisations | ||
|---|---|---|---|---|
| last reprioritisation on | suggested re-reading day | |||
| started reading on | finished reading on |
nerds and sales
The U.S. advertising industry collects annual revenues of $150 billion and employs more than 600,000 people. At $450 billion annually, the U.S. sales industry is even bigger. When they hear that 3.2 million Americans work in sales, seasoned executives will suspect the number is low, but engineers may sigh in bewilderment. What could that many salespeople possibly be doing? In Silicon Valley, nerds are skeptical of advertising, marketing, and sales because they seem superficial and irrational. But advertising matters because it works. It works on nerds, and it works on you. You may think that you’re an exception; that your preferences are authentic, and advertising only works on other people. It’s easy to resist the most obvious sales pitches, so we entertain a false confidence in our own independence of mind. But advertising doesn’t exist to make you buy a product right away; it exists to embed subtle impressions that will drive sales later. Anyone who can’t acknowledge its likely effect on himself is doubly deceived. Nerds are used to transparency. They add value by becoming expert at a technical skill like computer programming. In engineering disciplines, a solution either works or it fails. You can evaluate someone else’s work with relative ease, as surface appearances don’t matter much. Sales is the opposite: an orchestrated campaign to change surface appearances without changing the underlying reality. This strikes engineers as trivial if not fundamentally dishonest. They know their own jobs are hard, so when they look at salespeople laughing on the phone with a customer or going to two-hour lunches, they suspect that no real work is being done. If anything, people overestimate the relative difficulty of science and engineering, because the challenges of those fields are obvious. What nerds miss is that it takes hard work to make sales look easy
Flashcard 1419482893580
| status | not learned | measured difficulty | 37% [default] | last interval [days] | |||
|---|---|---|---|---|---|---|---|
| repetition number in this series | 0 | memorised on | scheduled repetition | ||||
| scheduled repetition interval | last repetition or drill |
Flashcard 1419487350028
| status | not learned | measured difficulty | 37% [default] | last interval [days] | |||
|---|---|---|---|---|---|---|---|
| repetition number in this series | 0 | memorised on | scheduled repetition | ||||
| scheduled repetition interval | last repetition or drill |
| status | not read | reprioritisations | ||
|---|---|---|---|---|
| last reprioritisation on | suggested re-reading day | |||
| started reading on | finished reading on |
Subject 1. Types of Markets
A market is any arrangement that enables buyers and sellers to get information and do business with each other. A competitive market is a market that has many buyers and many sellers so that no single buyer or seller can influence prices. Broadly speaking there are two types of markets: Goods markets are markets where final products from businesses or firms are exchanged. Households and firms are usually buyers and firms are sellers. Factor markets are markets for the factors of production. Factors include labor, capital, raw materials, entrepreneurship, etc. For example, in labor markets, households are sellers and firms are buyers. The demand for a factor exists because there is a demand for goods that the resource helps to produce. The demand for each factor is thus a derived demand; it is derived from the demand of consumers for products. For example, engineers are needed to design cars. A car manufacturer's demand for engineers thus depends entirely upon the demand for cars. The demand for engineers is a derived demand.
Flashcard 1419490233612
| status | not learned | measured difficulty | 37% [default] | last interval [days] | |||
|---|---|---|---|---|---|---|---|
| repetition number in this series | 0 | memorised on | scheduled repetition | ||||
| scheduled repetition interval | last repetition or drill |
Flashcard 1419492068620
| status | not learned | measured difficulty | 37% [default] | last interval [days] | |||
|---|---|---|---|---|---|---|---|
| repetition number in this series | 0 | memorised on | scheduled repetition | ||||
| scheduled repetition interval | last repetition or drill |


| status | not read | reprioritisations | ||
|---|---|---|---|---|
| last reprioritisation on | suggested re-reading day | |||
| started reading on | finished reading on |
Flashcard 1419496262924
| status | not learned | measured difficulty | 37% [default] | last interval [days] | |||
|---|---|---|---|---|---|---|---|
| repetition number in this series | 0 | memorised on | scheduled repetition | ||||
| scheduled repetition interval | last repetition or drill |
Flashcard 1419511991564
| status | not learned | measured difficulty | 37% [default] | last interval [days] | |||
|---|---|---|---|---|---|---|---|
| repetition number in this series | 0 | memorised on | scheduled repetition | ||||
| scheduled repetition interval | last repetition or drill |
Flashcard 1419513826572
| status | not learned | measured difficulty | 37% [default] | last interval [days] | |||
|---|---|---|---|---|---|---|---|
| repetition number in this series | 0 | memorised on | scheduled repetition | ||||
| scheduled repetition interval | last repetition or drill |
Flashcard 1419515661580
| status | not learned | measured difficulty | 37% [default] | last interval [days] | |||
|---|---|---|---|---|---|---|---|
| repetition number in this series | 0 | memorised on | scheduled repetition | ||||
| scheduled repetition interval | last repetition or drill |
Flashcard 1419517496588
| status | not learned | measured difficulty | 37% [default] | last interval [days] | |||
|---|---|---|---|---|---|---|---|
| repetition number in this series | 0 | memorised on | scheduled repetition | ||||
| scheduled repetition interval | last repetition or drill |
Flashcard 1419519331596
| status | not learned | measured difficulty | 37% [default] | last interval [days] | |||
|---|---|---|---|---|---|---|---|
| repetition number in this series | 0 | memorised on | scheduled repetition | ||||
| scheduled repetition interval | last repetition or drill |
Flashcard 1419521166604
| status | not learned | measured difficulty | 37% [default] | last interval [days] | |||
|---|---|---|---|---|---|---|---|
| repetition number in this series | 0 | memorised on | scheduled repetition | ||||
| scheduled repetition interval | last repetition or drill |
| status | not read | reprioritisations | ||
|---|---|---|---|---|
| last reprioritisation on | suggested re-reading day | |||
| started reading on | finished reading on |
Subject 2. Basic Principles and Concepts
The Demand Function and the Demand Curve The demand function represents buyers' behavior. Prices influence consumers' purchase decisions. The demand function can be depicted as a negatively sloped demand curve. If all other factors are equal, as the price of a good rises, consumer demand falls. This is mainly due to the availability of substitutes, which are goods that perform similar functions. As the price of a good falls, consumer demand rises. Therefore, there is an inverse relationship between the price of a good and the amount that consumers are willing to buy. The demand curve normally slopes downward. It tells the analyst the quantity that consumers are willing to buy for each possible price when all other influences on consumers' planned purchases remain the same. Example 1 Refer to the graph below. What is the quantity of cassettes demanded when their price is $4.00 per week? Answer: Two cassettes per week. The demand curve tells how much is demanded at each price. To determine the quantity demanded, find $4.00 on the vertical axis and read across until you meet the demand curve. Then read the quantity from the horizontal axis. When any factor that influences buying plans, other than the price of the good, changes, there is a change in demand for that good. When the quantity of the good tha
| status | not read | reprioritisations | ||
|---|---|---|---|---|
| last reprioritisation on | suggested re-reading day | |||
| started reading on | finished reading on |
Subject 2. Basic Principles and Concepts
e demand curve tells how much is demanded at each price. To determine the quantity demanded, find $4.00 on the vertical axis and read across until you meet the demand curve. Then read the quantity from the horizontal axis. <span>When any factor that influences buying plans, other than the price of the good, changes, there is a change in demand for that good. When the quantity of the good that people plan to buy changes at each and every price, there is a new demand curve. These factors include changes in income, number of consumers in the market, changes in the price of a related good, etc. Example 2 Assume the graph below reflects demand in the automobile market. Which arrow best captures the impact of increased consumer income on the automobile market? Answer: D. Income is a shift factor of demand. An increase in income increases the number of automobiles demanded at each price. Therefore demand has shifted to the right. When demand increases, the quantity that people plan to buy increases at each and every price, so the demand curve shifts rightward. When demand decreases, the quantity that people plan to buy decreases at each and every price, so the demand curve shifts leftward. A Change in the Quantity Demanded Versus a Change in Demand The demand curve isolates the impact of price on the amount of a product purchased.&
Flashcard 1419527195916
| status | not learned | measured difficulty | 37% [default] | last interval [days] | |||
|---|---|---|---|---|---|---|---|
| repetition number in this series | 0 | memorised on | scheduled repetition | ||||
| scheduled repetition interval | last repetition or drill |
Flashcard 1419529817356
| status | not learned | measured difficulty | 37% [default] | last interval [days] | |||
|---|---|---|---|---|---|---|---|
| repetition number in this series | 0 | memorised on | scheduled repetition | ||||
| scheduled repetition interval | last repetition or drill |
| status | not read | reprioritisations | ||
|---|---|---|---|---|
| last reprioritisation on | suggested re-reading day | |||
| started reading on | finished reading on |
Subject 2. Basic Principles and Concepts
ople plan to buy increases at each and every price, so the demand curve shifts rightward. When demand decreases, the quantity that people plan to buy decreases at each and every price, so the demand curve shifts leftward. <span>A Change in the Quantity Demanded Versus a Change in Demand The demand curve isolates the impact of price on the amount of a product purchased. A change in quantity demanded (caused by price change ONLY) is a movement along a demand curve from one point to another. Changes in other factors (anything other than price), such as income, tastes, expectations, and the prices of closely related goods, will shift the entire demand curve inwards or outwards. This is referred to as change in demand. Example 3 Refer to the graph below. Consumers began purchasing more of a product due to a decrease in price. Which arrow best represents this statement? Answer: C. A change in price causes a movement along the demand curve. When price falls, the movement is downward and to the right. The Supply Function and the Supply Curve Resources and technology determine what it is possible to produce. Supply reflects a decision about whic
Flashcard 1419534798092
| status | not learned | measured difficulty | 37% [default] | last interval [days] | |||
|---|---|---|---|---|---|---|---|
| repetition number in this series | 0 | memorised on | scheduled repetition | ||||
| scheduled repetition interval | last repetition or drill |

| status | not read | reprioritisations | ||
|---|---|---|---|---|
| last reprioritisation on | suggested re-reading day | |||
| started reading on | finished reading on |
Subject 2. Basic Principles and Concepts
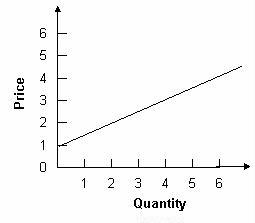
Which arrow best represents this statement? Answer: C. A change in price causes a movement along the demand curve. When price falls, the movement is downward and to the right. <span>The Supply Function and the Supply Curve Resources and technology determine what it is possible to produce. Supply reflects a decision about which technologically feasible items are best to produce. The supply function represents sellers' behavior. Prices influence producers' supply decisions. The supply function can be depicted as a positively sloped supply curve. If all other factors are equal, a higher price will increase the producer's incentive to supply the good. Higher prices increase the producer's profit, which is the excess of sales revenue over the cost of production. As the price of a good falls, its supply falls as well. Therefore, there is a direct relationship between the price of a good and the amount of that good that will be supplied. The supply curve slopes upward. It tells the analyst the quantity that producers are willing to supply for each price when all other influences on producers' planned sales remain the same. Example 4 The graph below displays the quantity associated with price in a supply table. To find the quantity supplied at a price of $1, extend a horizontal line from $1 to the supply curve and drop a vertical line down to the quantity axis. These lines will intersect at 0. This is the quantity that will be associated with a price of $1 on a supply table. The law of supply results from the general tendency for the marginal cost of producing a good or service to increase as the quantity produced increases. A supply curve is also a minimum-supply-price curve. The greater the quantity produced, the higher the price a firm must be offered to be willing to produce that quantity. A Change in Supply Changes in other factors will influence the amount of products that producers are willing to supply. These factors include the
Flashcard 1419537681676
| status | not learned | measured difficulty | 37% [default] | last interval [days] | |||
|---|---|---|---|---|---|---|---|
| repetition number in this series | 0 | memorised on | scheduled repetition | ||||
| scheduled repetition interval | last repetition or drill |
Flashcard 1419539516684
| status | not learned | measured difficulty | 37% [default] | last interval [days] | |||
|---|---|---|---|---|---|---|---|
| repetition number in this series | 0 | memorised on | scheduled repetition | ||||
| scheduled repetition interval | last repetition or drill |
Flashcard 1419541875980
| status | not learned | measured difficulty | 37% [default] | last interval [days] | |||
|---|---|---|---|---|---|---|---|
| repetition number in this series | 0 | memorised on | scheduled repetition | ||||
| scheduled repetition interval | last repetition or drill |
Flashcard 1419543710988
| status | not learned | measured difficulty | 37% [default] | last interval [days] | |||
|---|---|---|---|---|---|---|---|
| repetition number in this series | 0 | memorised on | scheduled repetition | ||||
| scheduled repetition interval | last repetition or drill |
Flashcard 1419545545996
| status | not learned | measured difficulty | 37% [default] | last interval [days] | |||
|---|---|---|---|---|---|---|---|
| repetition number in this series | 0 | memorised on | scheduled repetition | ||||
| scheduled repetition interval | last repetition or drill |
| status | not read | reprioritisations | ||
|---|---|---|---|---|
| last reprioritisation on | suggested re-reading day | |||
| started reading on | finished reading on |
Subject 2. Basic Principles and Concepts
in the cost of producing the good causes supply to shift leftward. An increase in the number of firms and a decrease in taxes cause supply to shift rightward. A change in price causes a movement along supply, not a shift. <span>A Change in the Quantity Supplied Versus a Change in Supply The quantity supplied of a good or service is the amount that producers plan to sell during a given time period at a particular price. Price is just one of the factors that affect producers' supply decisions. The supply curve isolates the impact of price on the quantity of a product supplied and assumes that all other factors stay the same. A change in quantity supplied is caused by a price change ONLY. It is a movement along the same supply curve. When one of the other factors that influence selling plans changes, there is a change in supply and a shift of the supply curve. Example 6 A tax will shift the supply curve up by the amount of the tax. At every price level, less is supplied. For example, at price P 0 , originally Q 0 is supplied. After the tax, Q 1 is supplied at price P 0 .<span><body><html>
Flashcard 1419548953868
| status | not learned | measured difficulty | 37% [default] | last interval [days] | |||
|---|---|---|---|---|---|---|---|
| repetition number in this series | 0 | memorised on | scheduled repetition | ||||
| scheduled repetition interval | last repetition or drill |
Flashcard 1419550788876
| status | not learned | measured difficulty | 37% [default] | last interval [days] | |||
|---|---|---|---|---|---|---|---|
| repetition number in this series | 0 | memorised on | scheduled repetition | ||||
| scheduled repetition interval | last repetition or drill |
Flashcard 1419553410316
| status | not learned | measured difficulty | 37% [default] | last interval [days] | |||
|---|---|---|---|---|---|---|---|
| repetition number in this series | 0 | memorised on | scheduled repetition | ||||
| scheduled repetition interval | last repetition or drill |
Flashcard 1419555245324
| status | not learned | measured difficulty | 37% [default] | last interval [days] | |||
|---|---|---|---|---|---|---|---|
| repetition number in this series | 0 | memorised on | scheduled repetition | ||||
| scheduled repetition interval | last repetition or drill |
| status | not read | reprioritisations | ||
|---|---|---|---|---|
| last reprioritisation on | suggested re-reading day | |||
| started reading on | finished reading on |
Subject 3. Market Equilibrium
Aggregate Demand and Aggregate Supply An aggregate demand curve is simply a schedule that shows amounts of a product that buyers collectively desire to purchase at each possible price level. An aggregate supply curve is simply a curve showing the amounts of a product that all firms will produce at each price level. Example 1 Refer to the graph below. What is the market quantity that would be supplied at a price of $2.00? Market quantity is the sum of individual quantities supplied at each price. At a price of $2.00, Ann supplies 4, Barry supplies 3, and Charlie supplies 0. The market supply is 7. Market Equilibrium Equilibrium is a state in which conflicting forces are in balance. In equilibrium, it will be possible for both buyers and sel
Flashcard 1419558128908
| status | not learned | measured difficulty | 37% [default] | last interval [days] | |||
|---|---|---|---|---|---|---|---|
| repetition number in this series | 0 | memorised on | scheduled repetition | ||||
| scheduled repetition interval | last repetition or drill |
Flashcard 1419561274636
| status | not learned | measured difficulty | 37% [default] | last interval [days] | |||
|---|---|---|---|---|---|---|---|
| repetition number in this series | 0 | memorised on | scheduled repetition | ||||
| scheduled repetition interval | last repetition or drill |
Flashcard 1419563109644
| status | not learned | measured difficulty | 37% [default] | last interval [days] | |||
|---|---|---|---|---|---|---|---|
| repetition number in this series | 0 | memorised on | scheduled repetition | ||||
| scheduled repetition interval | last repetition or drill |
Flashcard 1419564944652
| status | not learned | measured difficulty | 37% [default] | last interval [days] | |||
|---|---|---|---|---|---|---|---|
| repetition number in this series | 0 | memorised on | scheduled repetition | ||||
| scheduled repetition interval | last repetition or drill |
| status | not read | reprioritisations | ||
|---|---|---|---|---|
| last reprioritisation on | suggested re-reading day | |||
| started reading on | finished reading on |
Subject 3. Market Equilibrium
; Market quantity is the sum of individual quantities supplied at each price. At a price of $2.00, Ann supplies 4, Barry supplies 3, and Charlie supplies 0. The market supply is 7. <span>Market Equilibrium Equilibrium is a state in which conflicting forces are in balance. In equilibrium, it will be possible for both buyers and sellers to realize their goals simultaneously. The following graph depicts the market supply and demand for concert tickets at Madison Square Garden in New York City. Equilibrium price and quantity are where the supply and demand curves intersect. Draw a horizontal line from the intersection to the price axis. This is equilibrium price: $60. Draw a vertical line from the intersection to the quantity axis. This is equilibrium quantity: 300. It is equilibrium because quantity demanded equals quantity supplied at $60 per ticket. At this price, there is neither surplus (excess supply) nor shortage (excess demand), so there is no downward or upward pressure for the price to change. Surplus will push prices downward towards equilibrium. Suppose the price is initially above the equilibrium price (P 2 ) and sits at P 1 . Quantity supplied (Q 1s ) will exceed quantity demanded (Q 1D ), creating a surplus. The surplus will put downward pressure on prices since producers will begin to lower their prices to sell the surplus. As a result, the price will fall, the quantity supplied will decrease, and the quantity demanded will increase until the equilibrium price (P 2 ) is restored. This process involves movements along supply-and-demand curves since the changes are caused by price fluctuations. Similarly, shortages push prices upward towards equilibrium. Because the price rises if it is below equilibrium, falls if it is above equilibrium, and remains constant if it is at equilibrium, the price is pulled toward equilibrium and remains there until some event changes the equilibrium. We refer to such an equilibrium as being stable because whenever price is disturbed away from the equilibrium, it tends to converge back to that equilibrium. An unstable equilibrium is an equilibrium that is not restored if disrupted by an external force. While most equilibria studied in economics are of the stable variety, a few cases of unstable equilibria do emerge from time to time, in limited circumstances.<span><body><html>